Lap Time Simulator
Moto, Lap time, Racing, Software
Project sumary
Since 2019, I’ve been looking for a lap time simulator that can estimate lap times for a given motorcycle setup on a given track. Beyond lap time estimation, I want a tool that shows performance sensitivity so I can evaluate which setup parameter contributes most. Many well-known software programs can estimate a race car's lap time on a track; however, very few exist for motorcycles because of the complexity of chassis and tire behavior. Those few are either hidden behind an extreme paywall or lack crucial features that I wanted to explore. As a result, I decided to build my own software that can be fed the most common racing data logger data to re-create the track, plus a friendly but powerful interface to describe the motorcycle setup.
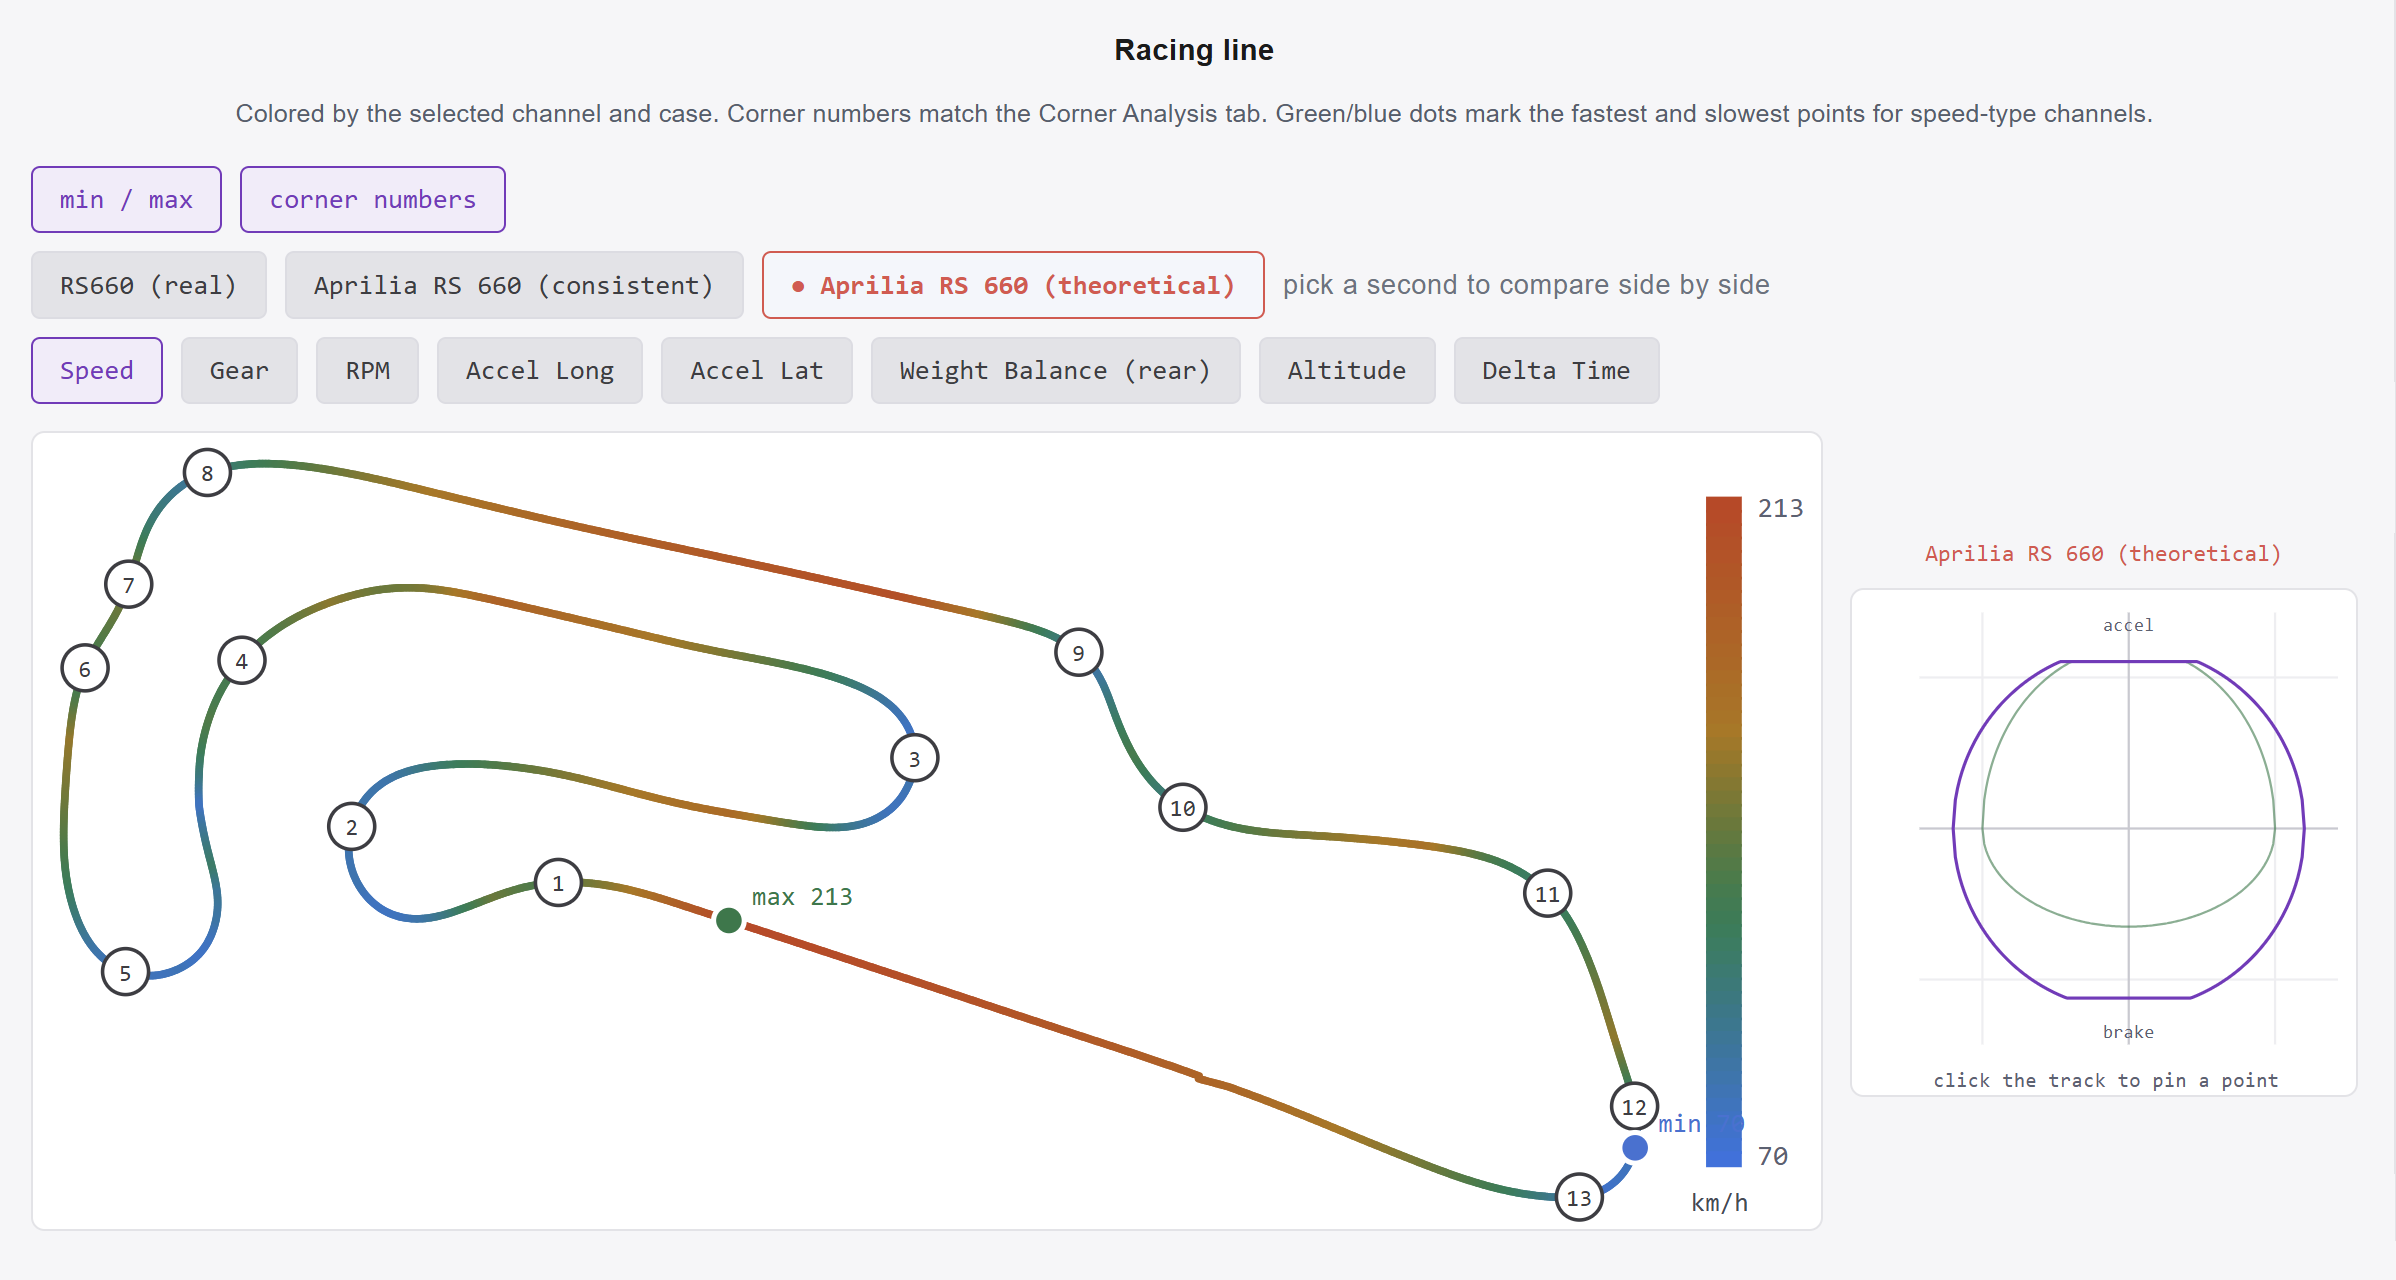
1. Build track geometry and the ridden line from exported AiM telemetry - curvature, slope, and altitude recovered from GPS at 1 m resolution
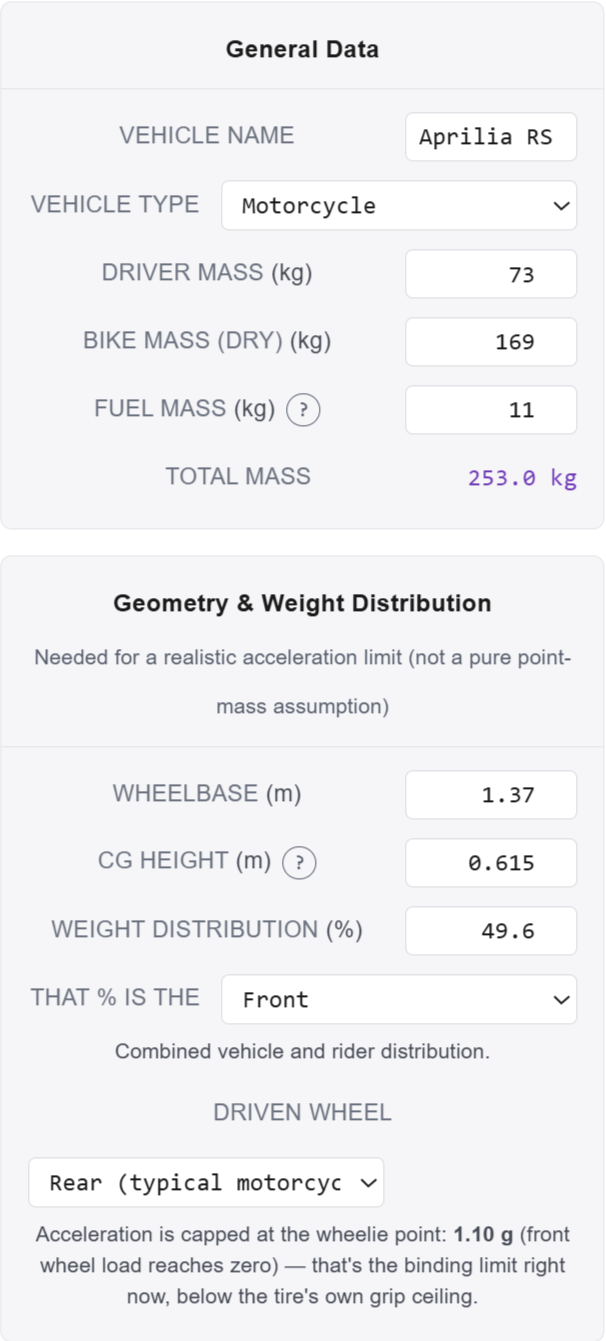
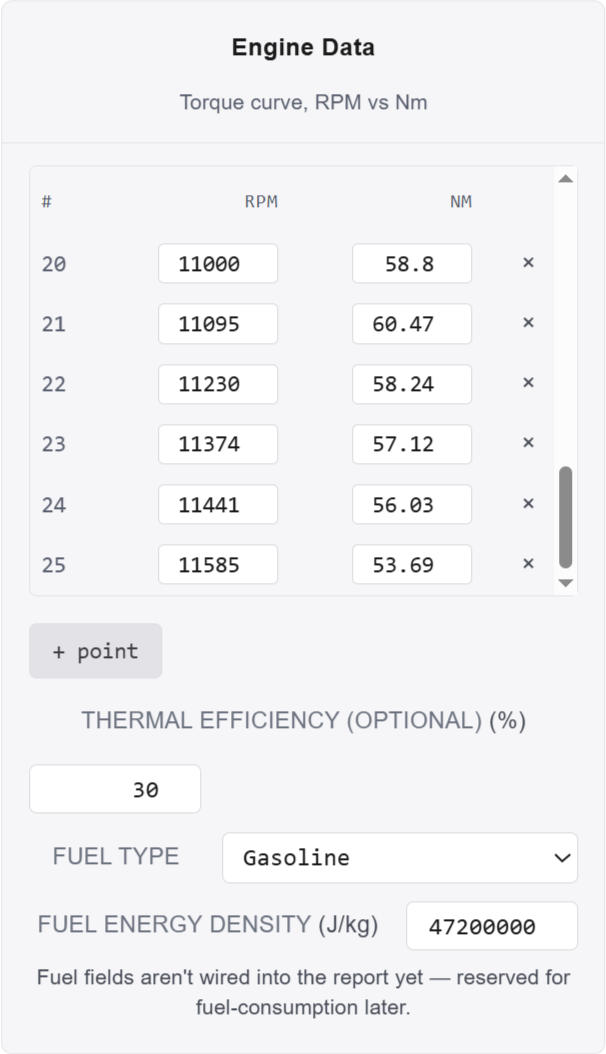
2. Provide an interface for the machine: engine, gearbox as tooth counts, tire, aero, mass, geometry, and rotational inertia, in one portable config
3. Solve the lap with one shared friction budget across lateral, braking, and drive, capped by the wheelie and stoppie moment balances, with CoG, rotational inertia, and tire curvature at lean
4. Separate machine capability from rider capability, so one config gives both the theoretical lap and the rider's own — the gap is the training target
Project objectives
Results
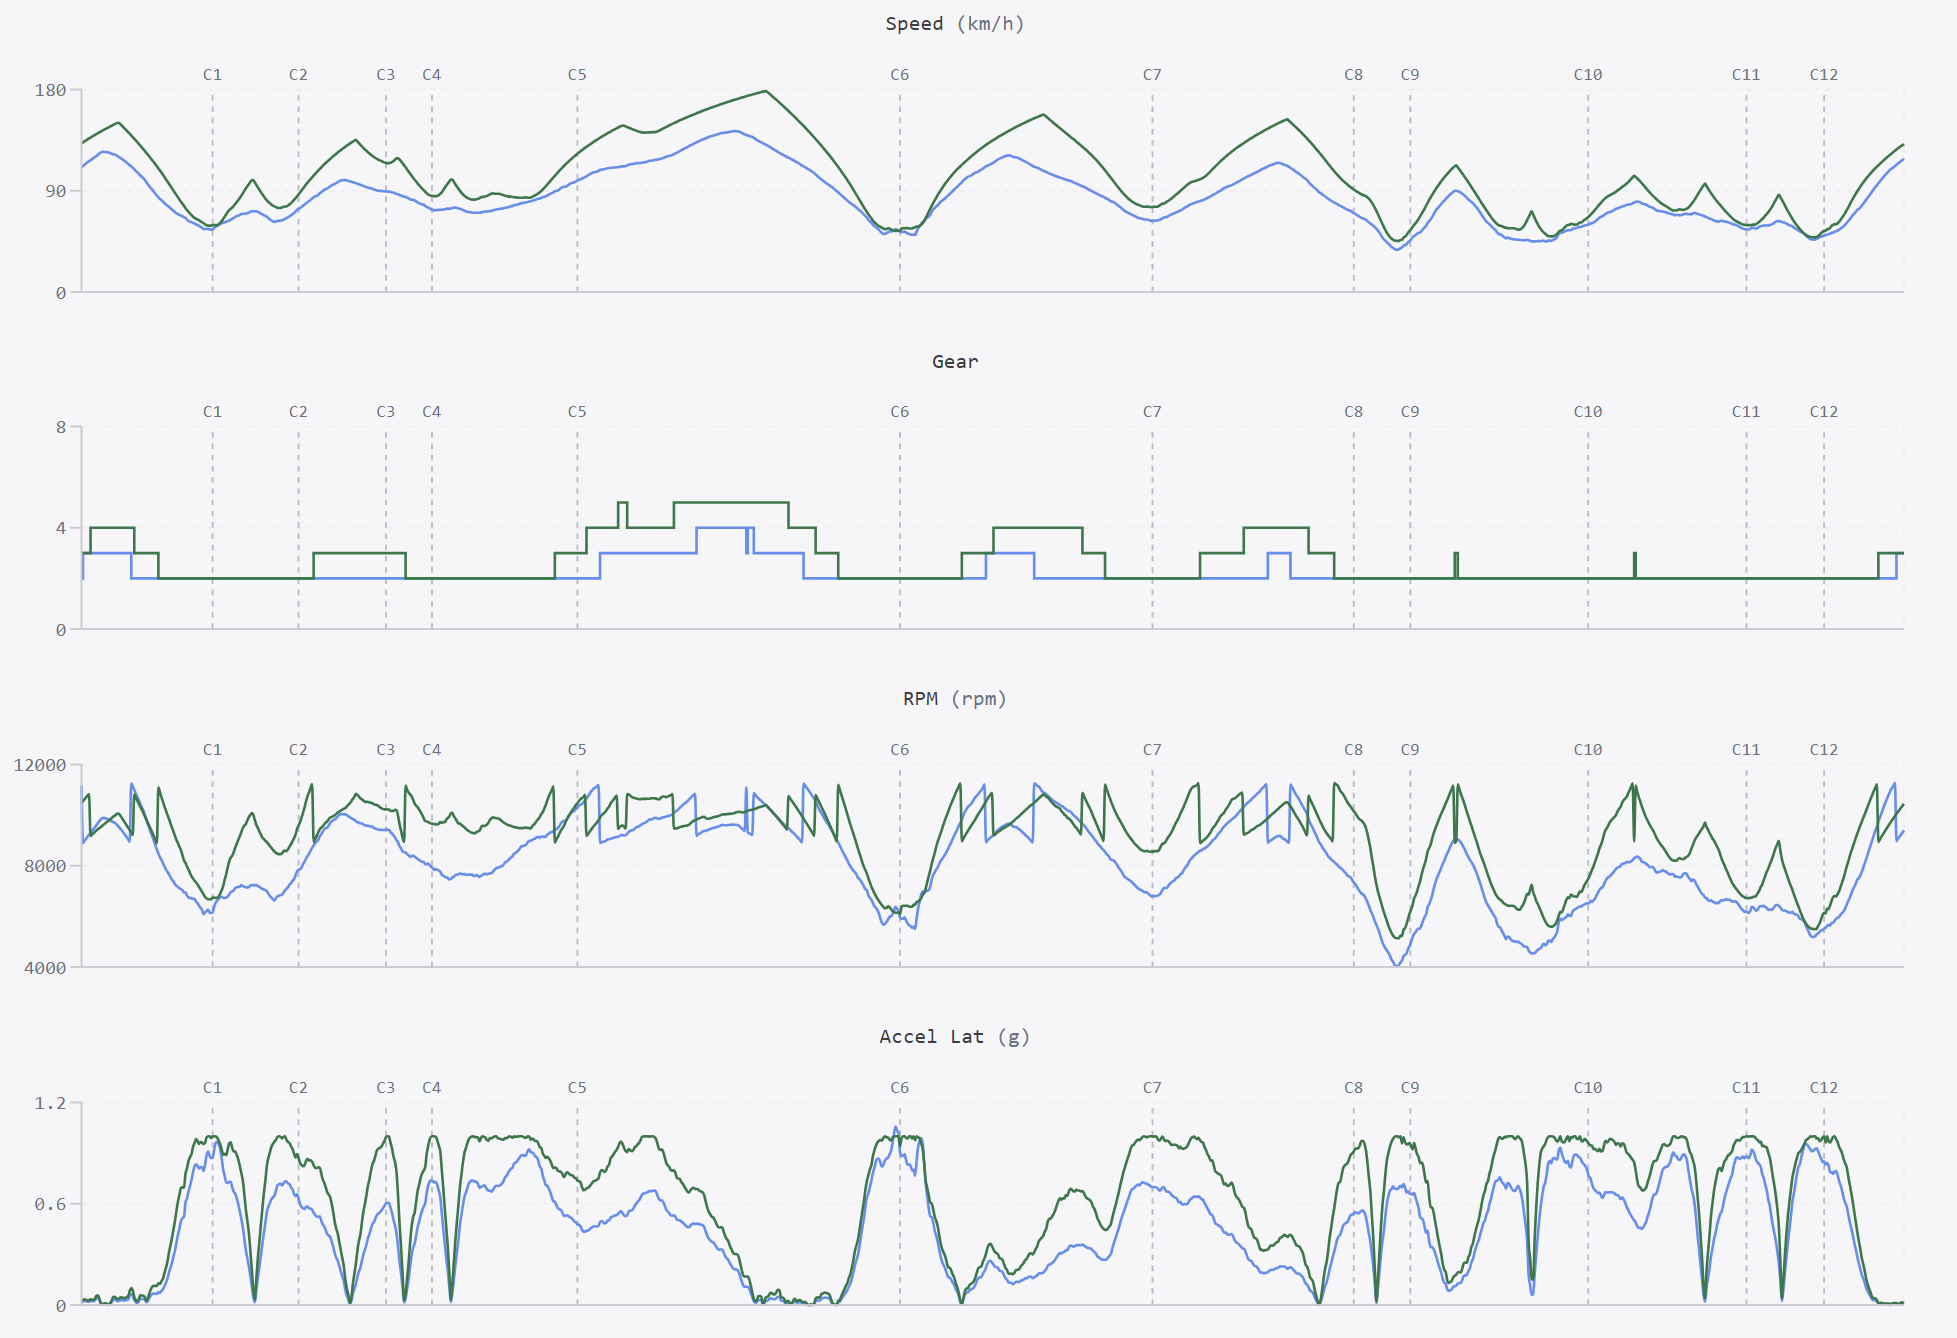
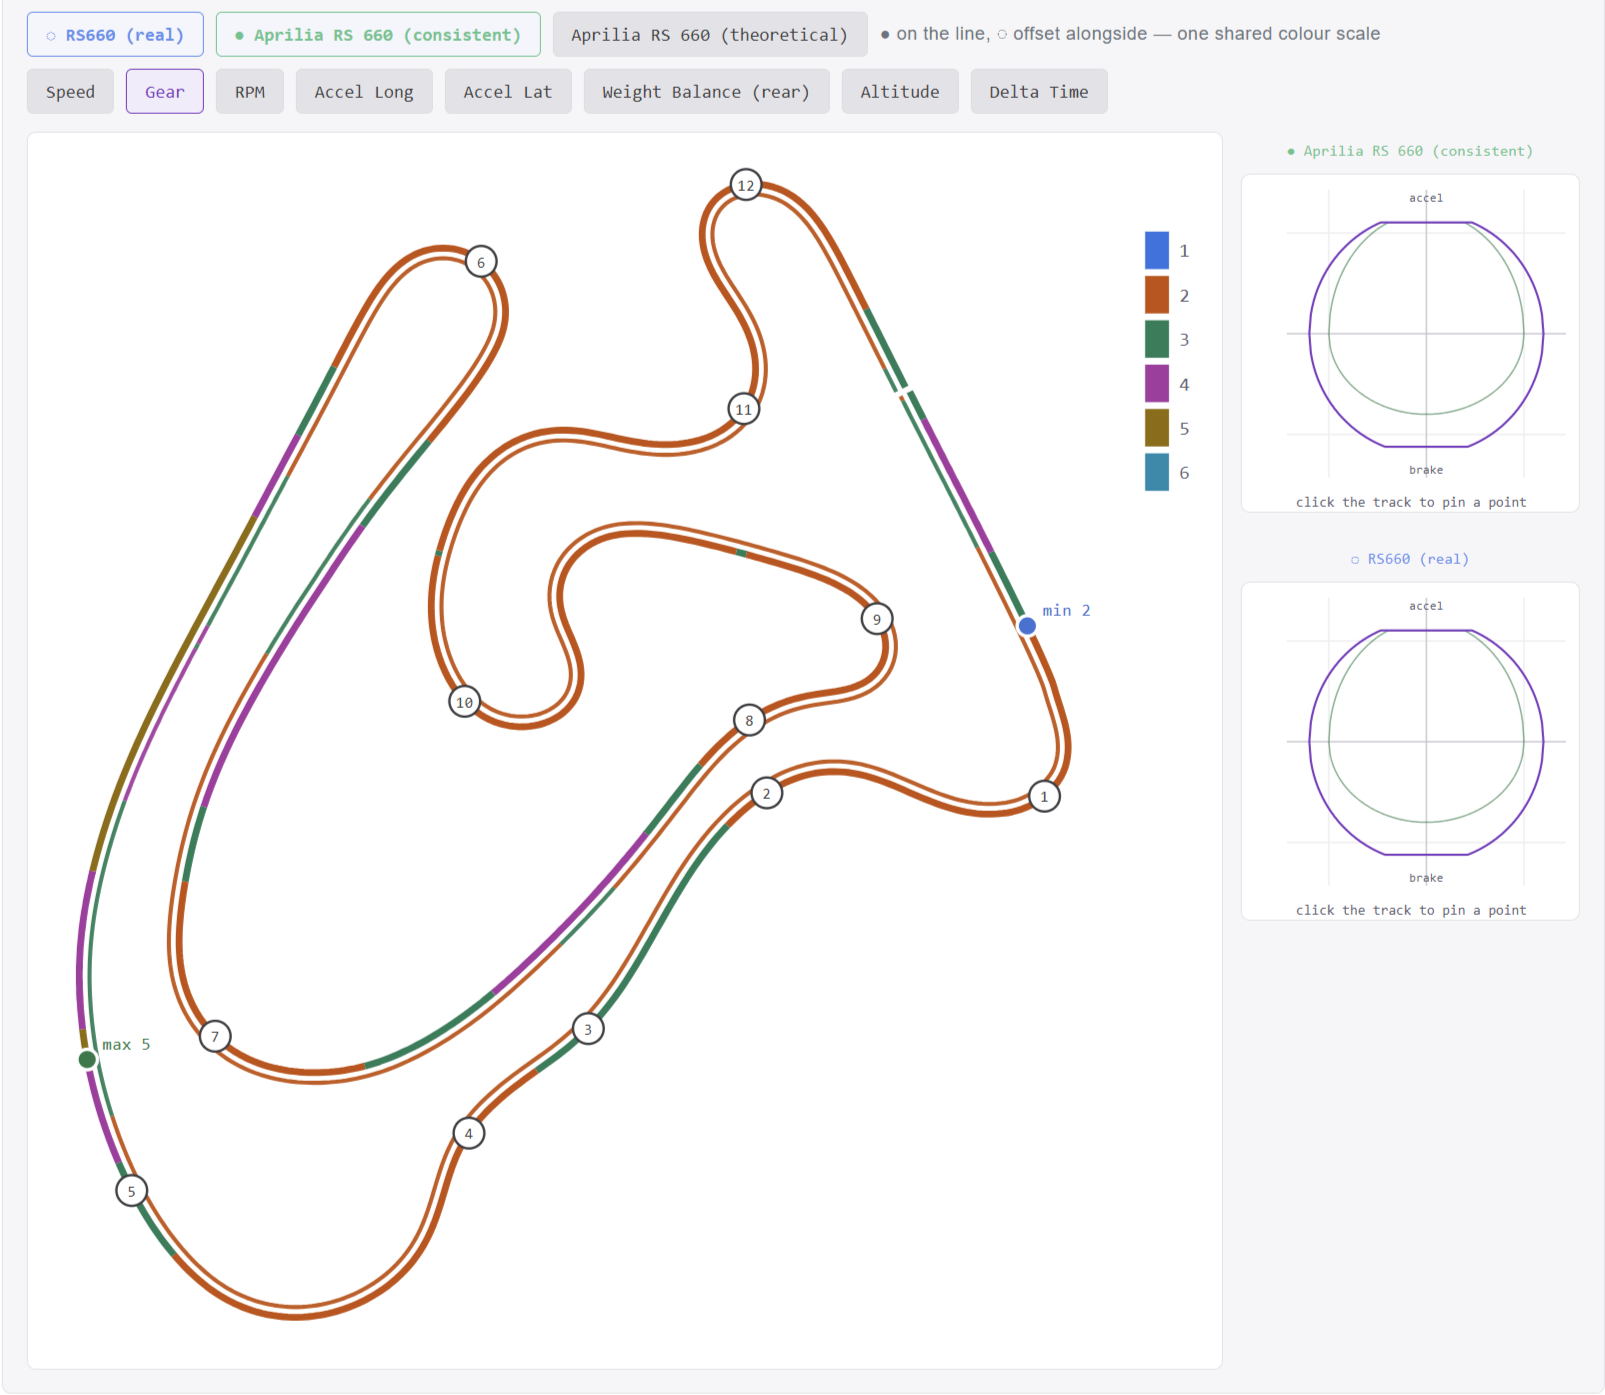
The simulator's initial task was to show how far I was from the AP RS660's real performance at my home track, the STC Spreewald Ring. After at least 5-6 track days under various conditions, I still couldn't manage a flying lap.
For a realistic estimate, I inserted my abilities in the simulator as follows:
Braking peak deceleration 0,8 G
Peak lean angle 50,2 degrees
Total weight in gear: 78 kg
I blocked the simulator from using the first gear and downshifting at angles below 45 degrees (just scary)
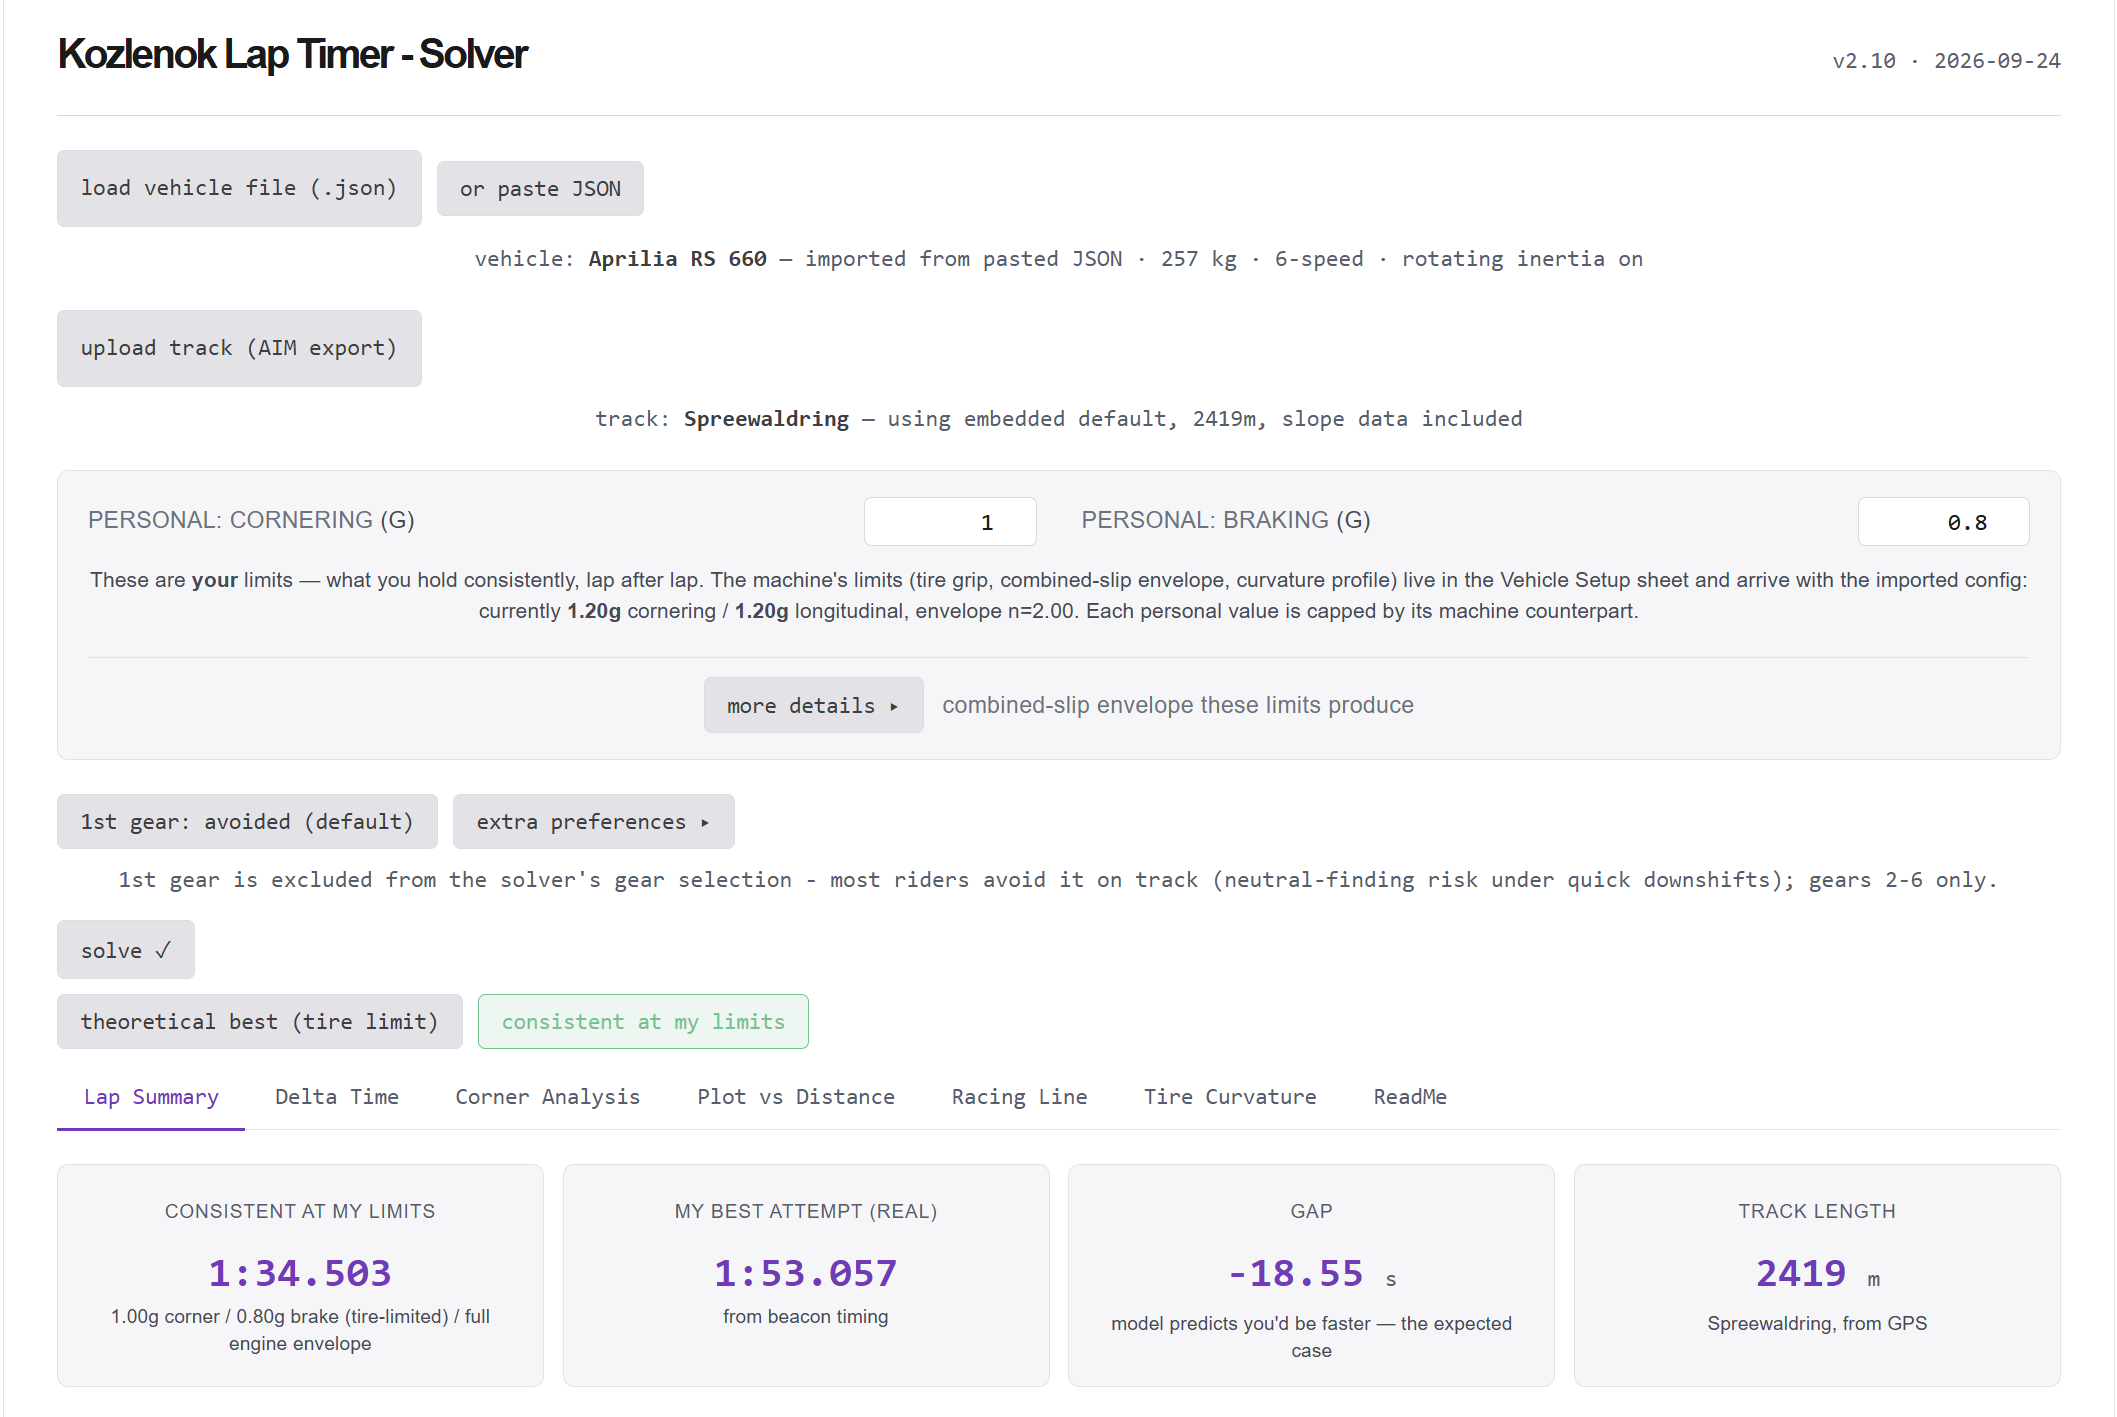
Key findings:
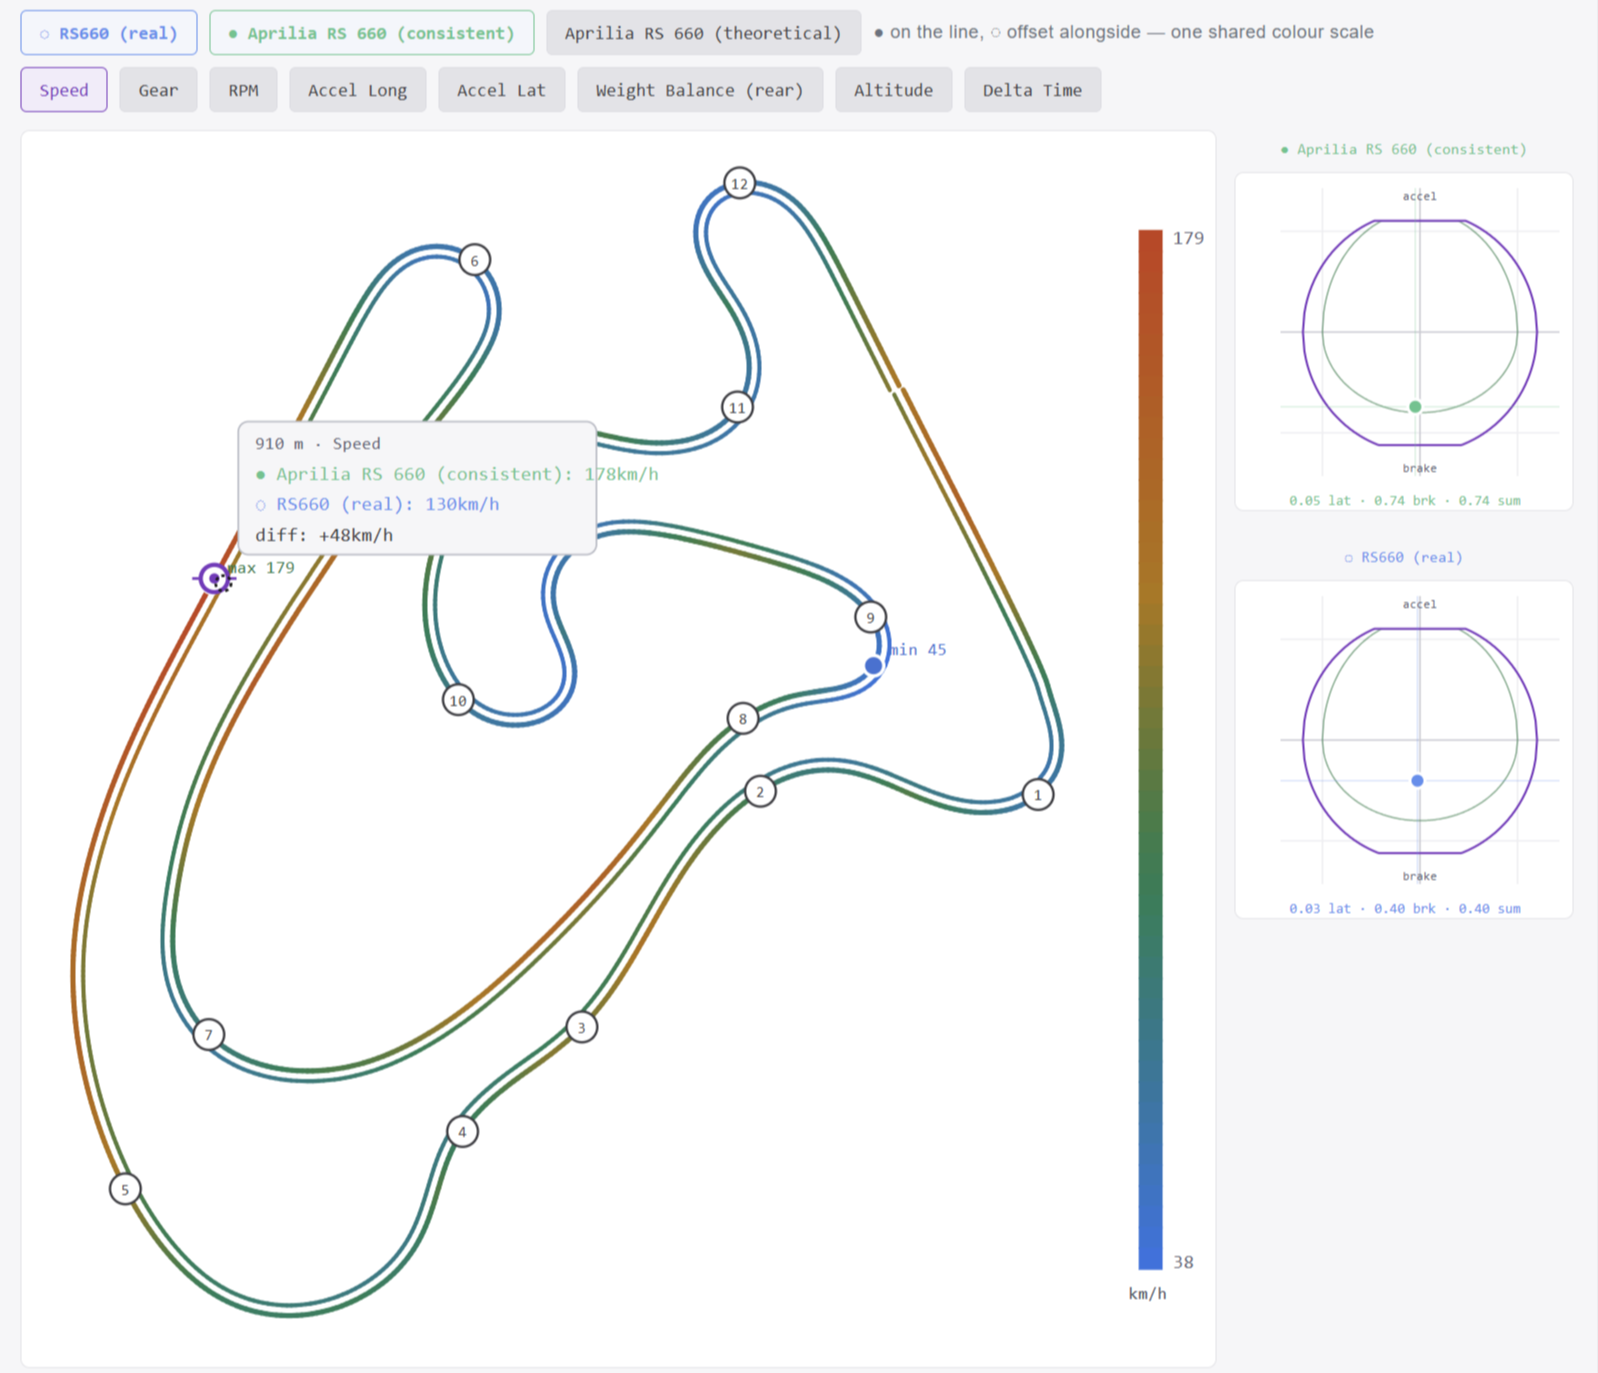
Braking is used at roughly 45% of what the tire allows - and that ratio barely changes with lean. Peak: 0.8 G upright, 0.53/0.41/0.35 G as lean increases. Trail braking is present, not absent; it's simply scaled down along with everything else. Improving lap time by 7.1 s.
Commitment falls away with corner speed, not with steering rate. I exceed the model's lean angle in every corner tighter than 30 m (56° in C6, 52° in C1) - and fall 10-12° short in the fast ones, C3, C7 and C8. This is a confidence limit at speed, not a physical one: I already produce a roll rate of 34 °/s at the 90th percentile and 99 °/s at peak, which could cover most of what the faster line needs.
Two-thirds of the available lap time needs no new skill, only repetition. Running my own measured peaks everywhere would give at least 17 seconds - before any improvement in grip usage.
A fifth of the lap is spent coasting, and almost all of it is mid-corner. At 17.7% of the distance and 20.9% of the lap time - 23.7 seconds - I'm neither braking nor driving, and 94% of that loss comes at more than 20° of lean rather than in the upright gap between brake release and throttle pickup. It is not sloppy transitions; it is the hole left by braking that ends too early, leaving the bike to roll until it is straight enough to drive. Worth 3.4 s, and the same fix works from either end: carry the brake deeper, or get to throttle sooner.
Reducing the driver's weight by 5 kg and riding half of the fuel tank will only contribute 0,12 seconds per lap.
↓ Boring section below ↓
1. Simulator Input
The simulator input consists of the following categories:
Vehicle data
Engine torque versus RPM
Gearbox ratio
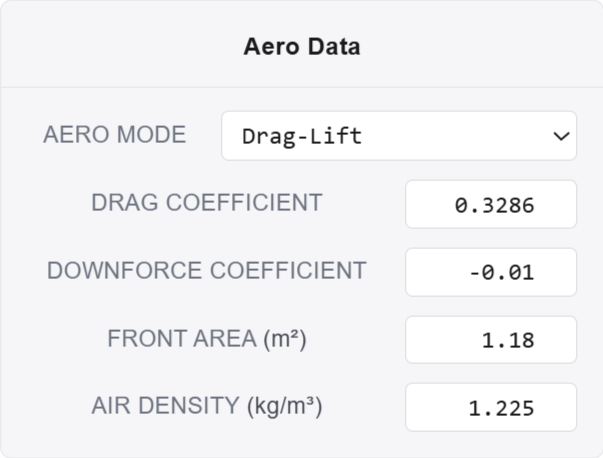
Aerodynamic performance (lift, drag, and frontal area)
Chassis parameters (mass, CoG position, wheelbase, initial weight distribution)
Optional rotating mass inertia (front and rear wheel assemblies, crankshaft clutch assembly)
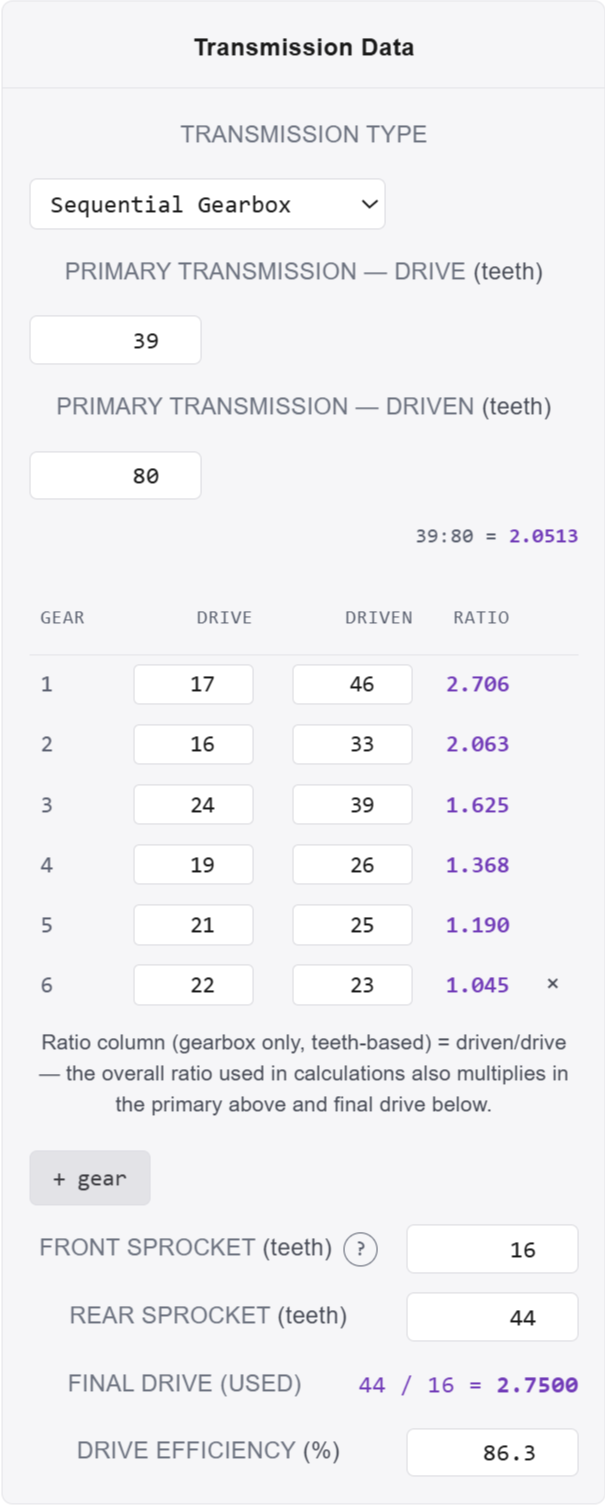
Tire input
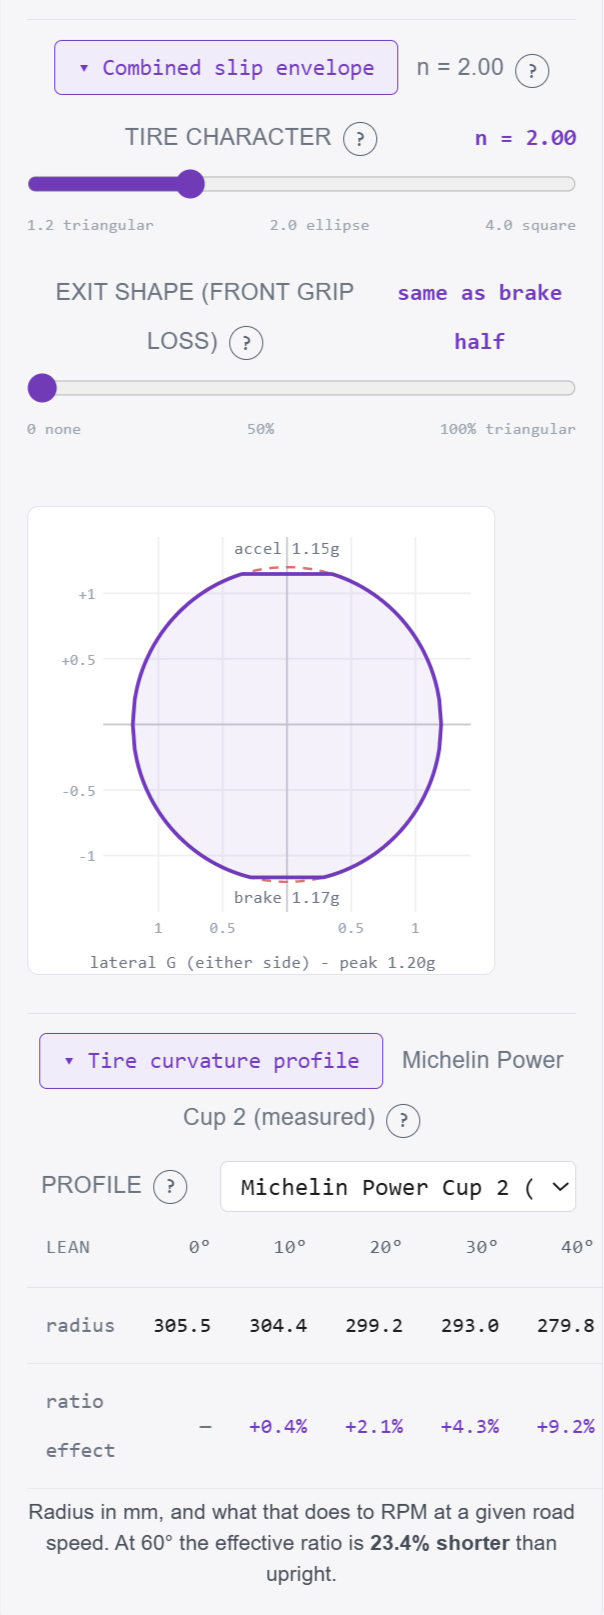
G-G Diagram based on the lateral and longitudinal peak performance
Combined slip envelope
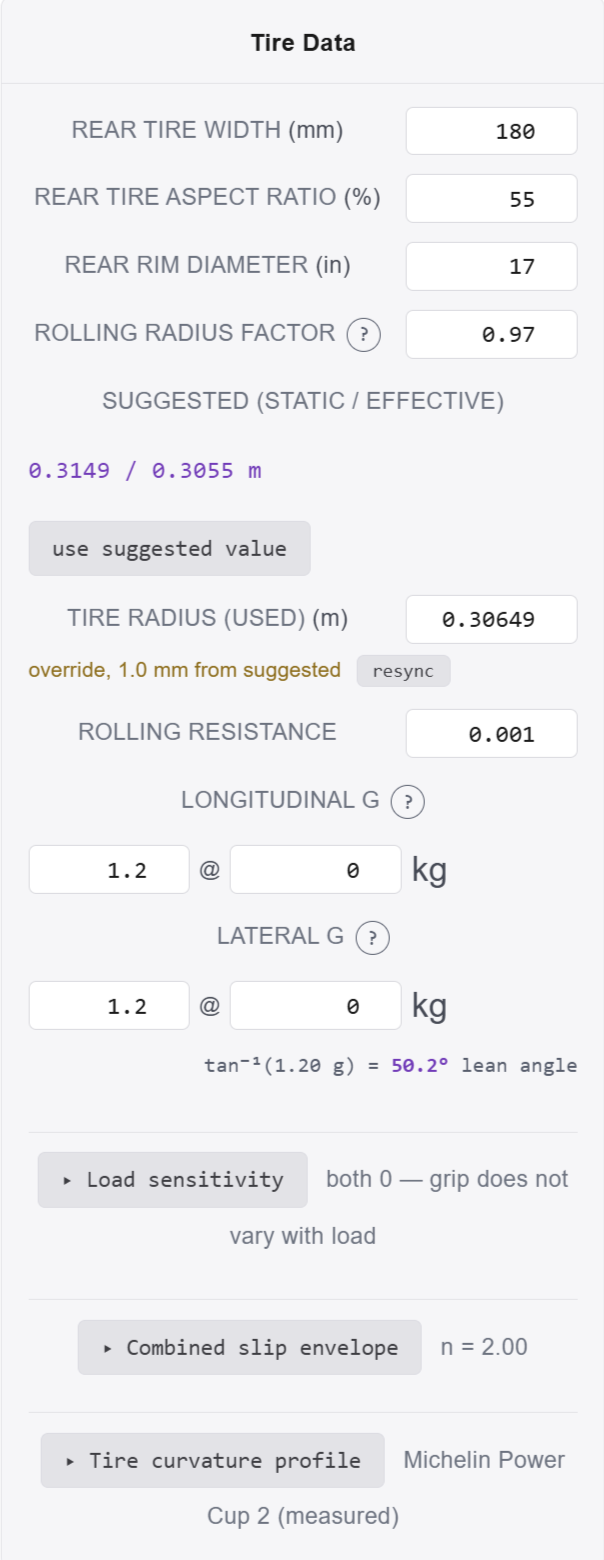
Tire curvature (affecting the wheel radius at lean)
Loaded radius
Track input
Import the .csv file from the AIM data logger
Start/Finish coordinate setup
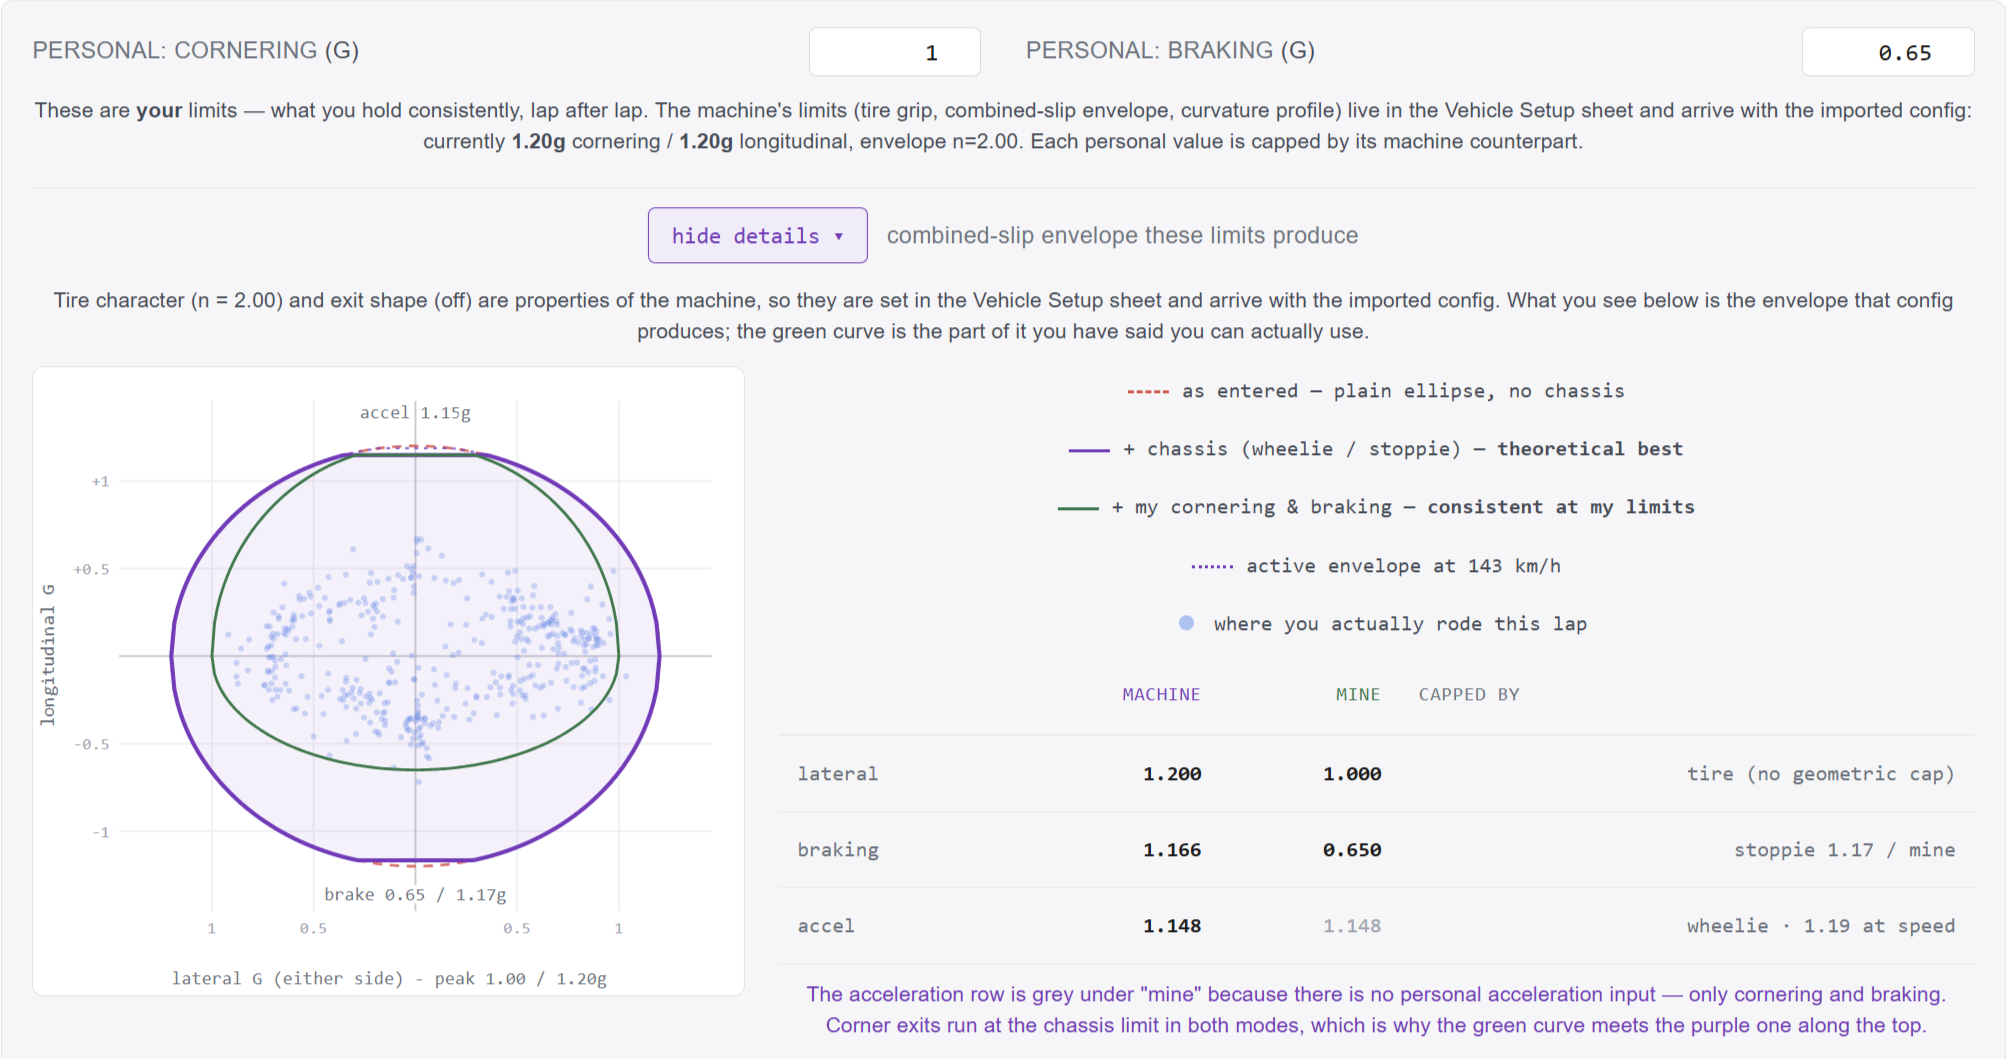
Personal limits (to simulate a consistent lap within the driver's abilities)
Cornering abilities/Lean angle
Braking abilities/Peak deceleration
2. Solver
The solver's first step is to convert data input from the AIM dashboard into racing-line curvature. The calculated curvature is used to evaluate a maximum cornering speed at every point for the given tire data input. To simulate speed, the solver performs forward and backward passes over three iterations to converge on the vehicle's theoretical speed. Cornering entry and exit are evaluated based on the traction ellipse estimation, with maximum acceleration and deceleration capped by the chassis CoG and wheelbase parameters.
3. Accuracy and Validation
Validated parameters:
Vehicle performance was validated using a lap timer with a 20 Hz GPS
Top speed at selected gearing was recorded (224.3 km/h with 16/44 gearing)
Aerodynamic performance and rotating mass inertia were estimated based on the Dyno plot and measured top speed and vehicle acceleration
CoG of the vehicle with rider was measured
Tire traction ellipse was estimated based on the recorded point cloud on the real race track
Achieved lean angle 50,2 degrees
Peak acceleration is limited by the wheelie control and measured
Peak braking performance provided by professional pilots using the same tire model
Curvature validated against measured lateral acceleration — an input independent of the path geometry — to below 0,7% median bias across three circuits