Cookstown 100 Race Engineering

Road Racing, Vehicles Dynamics, Simulation, Data Acquisition, Data Analysis, Coaching
In 2020 I had the opportunity to participate as a race engineer in the Irish Road Racing Championship. In the iconic Cookstown 100 race, I worked with the first Russian Manx Grand Prix pilot — Danila Krasniuk and his Honda CBR600RR motorcycle. Because of the lockdown, the race was postponed to September. This fact strongly influenced the chassis setup and racing strategy due to the specific weather conditions. Despite the difficulties, we won the qualifying session and performed well in the race.
Project summary
• Lap time simulation
• Data acquisition
• Chassis and suspension setup
• Engineering support
Responsibilities
1. Analysis of the racetrack and motorcycle
2. Free practice and data analysis
3. Race preparation
Project objectives
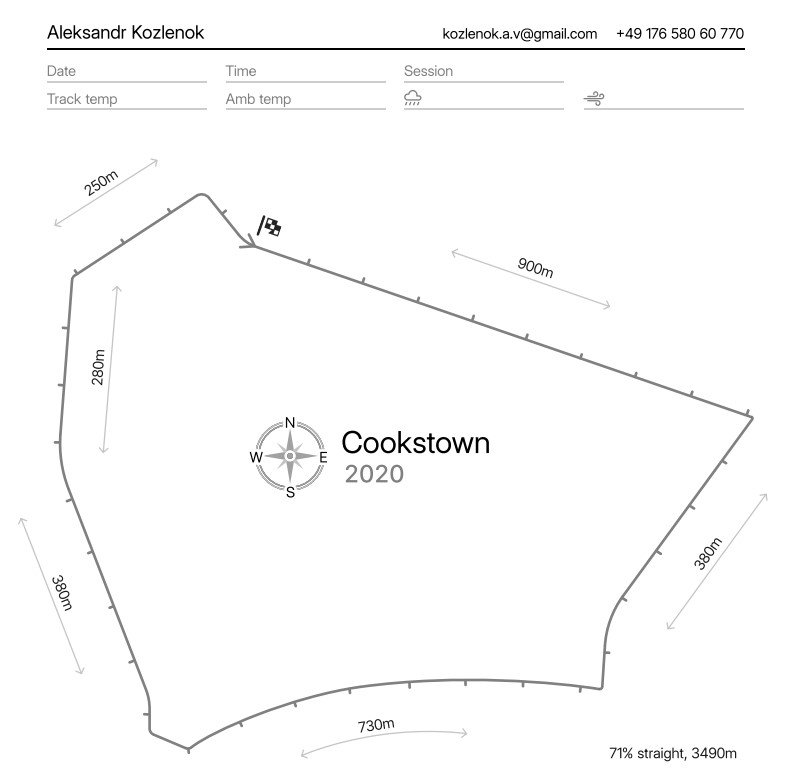
Due to the lack of open data, detailed track conditions and acquired data from other riders, I started my preparations by modelling the track and motorcycle dynamics. The track layout was built using open-source GPS maps to analyse possible racing lines. The analysis showed that the track was mainly made up of straight sections (up to 71%), a fast left-hand corner, and slow blind right-hand corners. Based on this, the priority was to perform slow-corner exits effectively to achieve the highest speed at the end of straights. For a detailed understanding of the track surface and practice conditions, I prepared the race sheet that also accommodated notes regarding motorbike behaviour and rider feeling.
1. Analysis of the racetrack and motorcycle
Based on the dynamometer data and the given final drive ratio, I created a simplified CBR600RR traction model and simulated the approximate lap time.


The simplified mathematical model included the following parameters:
• The power output characteristic
• The mass of the motorbike and the pilot
• Simplified tire model
• Frontal area and average drag coefficient
• Single racing line with equal grip
After completing the first practice, we compared the simulation results and the data acquisition log. As you can see in the picture below, the model did not consider the strong slope of the start-finish line and bumps in the fast left-hand corner (1700-2000m section). We can also note that the bike's weight distribution was initially set up for efficient acceleration, and the search for safe braking points in FP1 explains the inefficiencies in braking. However, the error in the lap time simulation does not exceed 9% (1m 41s VBOX vs 1m 51s simulation lap time).
2. Free practice and data analysis

Further analysis was carried out, and we confirmed that acceleration and braking performance should be prioritised (given the specific nature of road racing). Using a simplified motorbike and lap time model (at least 91% accuracy), we were able to determine the model's sensitivity to the motorbike parameters or conditions changes. Subsequently, we analysed the combination of longitudinal and lateral acceleration of the motorbike to determine which had the biggest effect on the lap time. Even though the increases in both parameters were needed, they were unachievable due to the opposing requirements for stiffness and damping in the braking areas and fast cornering sections with road irregularities.
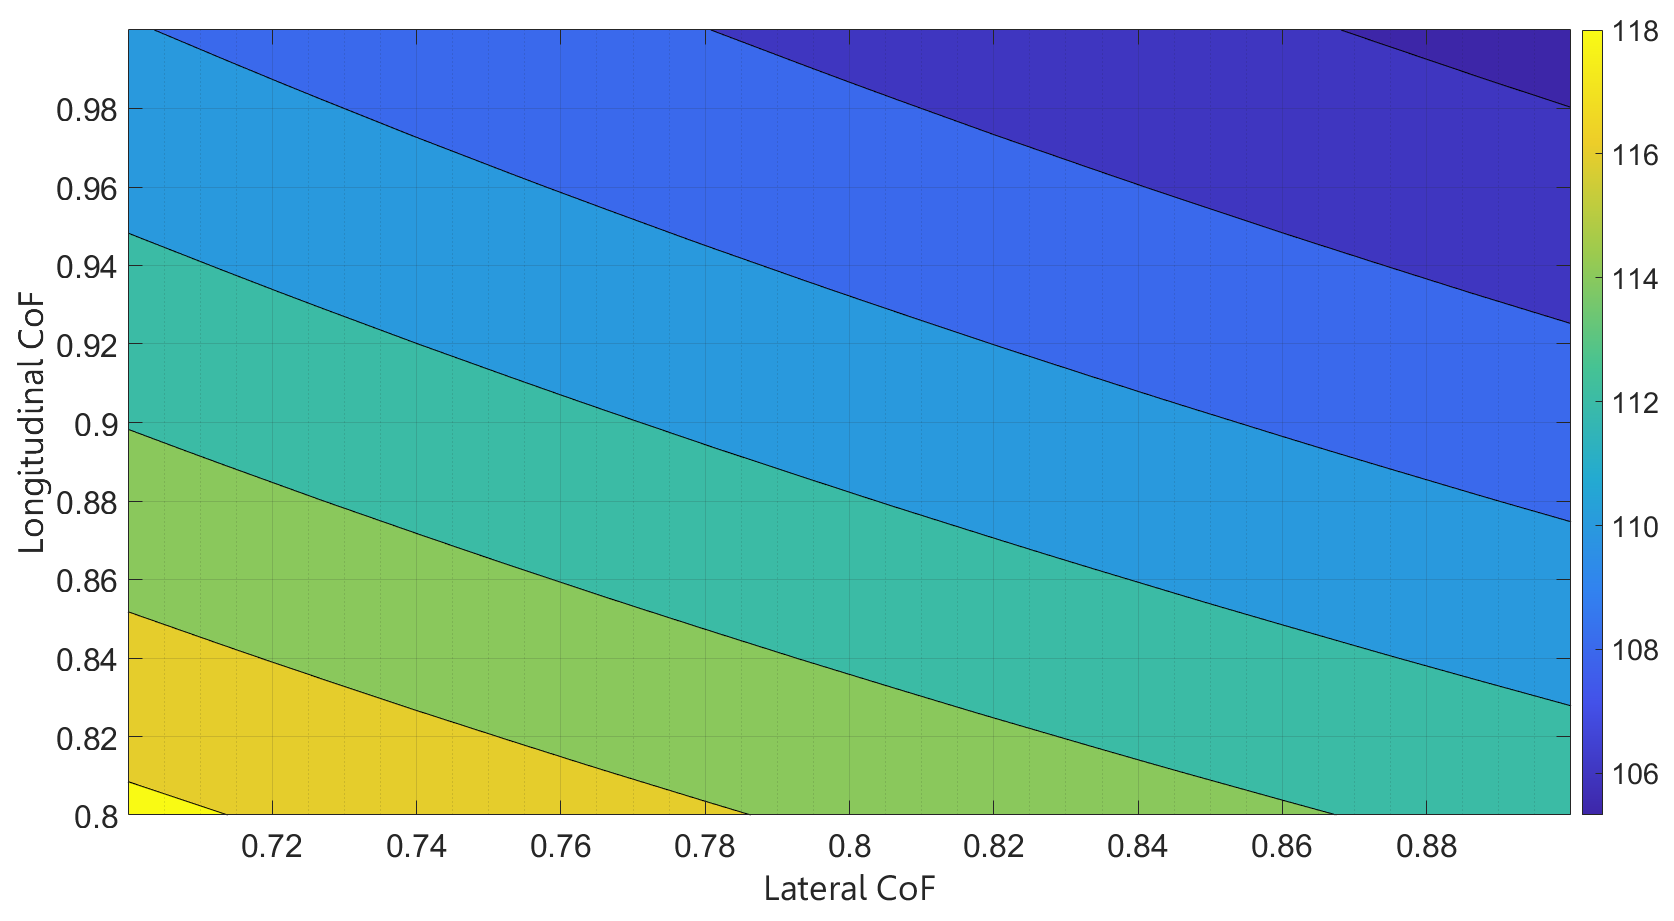
The plot above shows that the model is more sensitive to the longitudinal acceleration parameter (the colour bar represents lap time in seconds). Accordingly, its increase gives a more significant reduction in lap time.
According to the simulation results and FP1 data, we implemented the following changes:
• Changed the weight distribution (shifted the balance to the rear)
• Reduced the slow rebound damping
• Added slow compression damping to the front suspension
Making these changes to the chassis setup helped the driver to achieve a good lap time and win a qualifying session in the category. Overlaying braking lines on the GPS map allowed reference points to be identified for different braking tactics. The analysis of FP2 and qualifying lap data revealed the mean deceleration and the required braking distance for the first corner entry after the start/finish line (in a 95% confidence interval).
3. Race preparation

The mean braking point and distance based on the second practice are highlighted in red. The red distance was measured as 302 metres, and the average deceleration was −0,7G. The braking highlighted in yellow was the most effective in the 95% confidence interval. It took 270,35 metres with an average deceleration of −0,78G. After identifying the braking points and gears in all corner entries, we agreed on the main tactics and prepared the motorcycle for the race.
As a result, we won the qualifying session and took 4th place in the race. By shifting the weight distribution and adjusting the front suspension for the first corner braking, we cut the lap time by 0,8 seconds. Reducing the rear suspension rebound damping allowed us to go full throttle earlier in the fast left-hand corner, which reduced the lap time by another 0,9 seconds. The overall lap time improvement was 3,62 seconds (Qualifying lap vs best FP1 lap).
Key results

The analysis showed that the new setup enabled much better tire utilization in the braking phase and at the exit of the right-hand corners. The scatter plot below confirms that by comparing the G-G diagrams of FP1 and Race.
