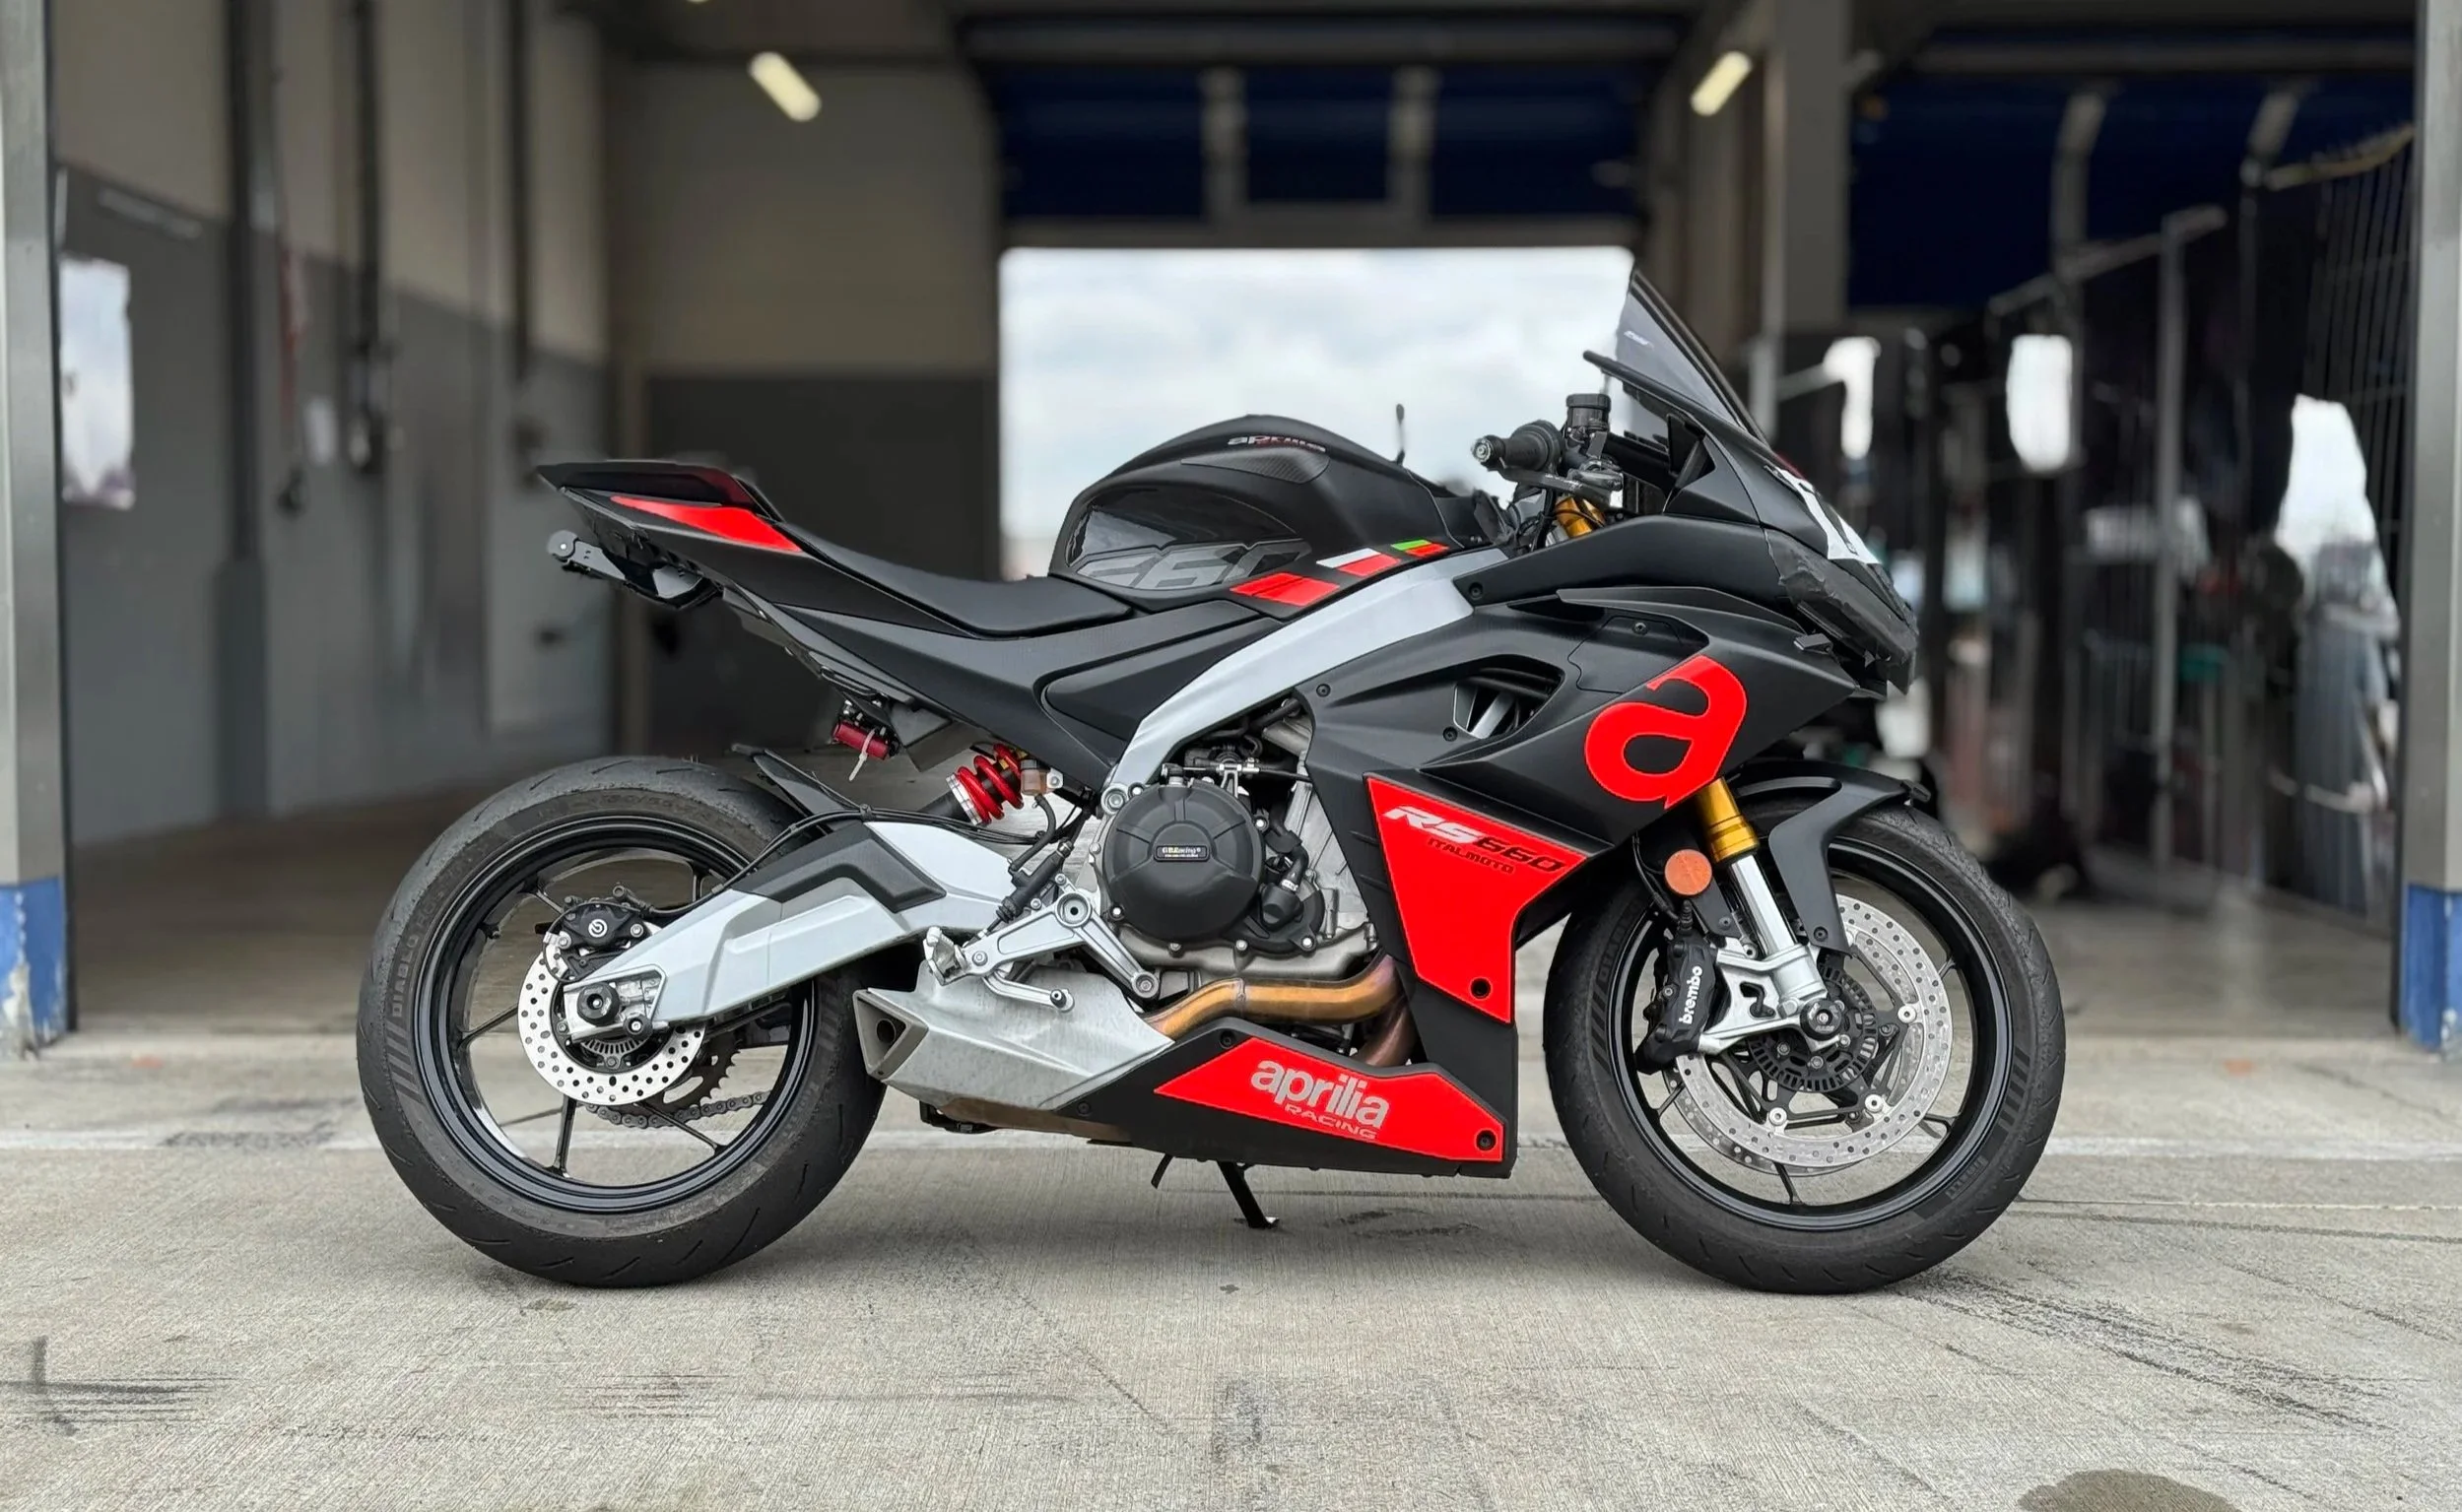
Season Kick-off RS660 2026
Aprilia RS660, Track Days, Data Acquisition, Suspension Setup
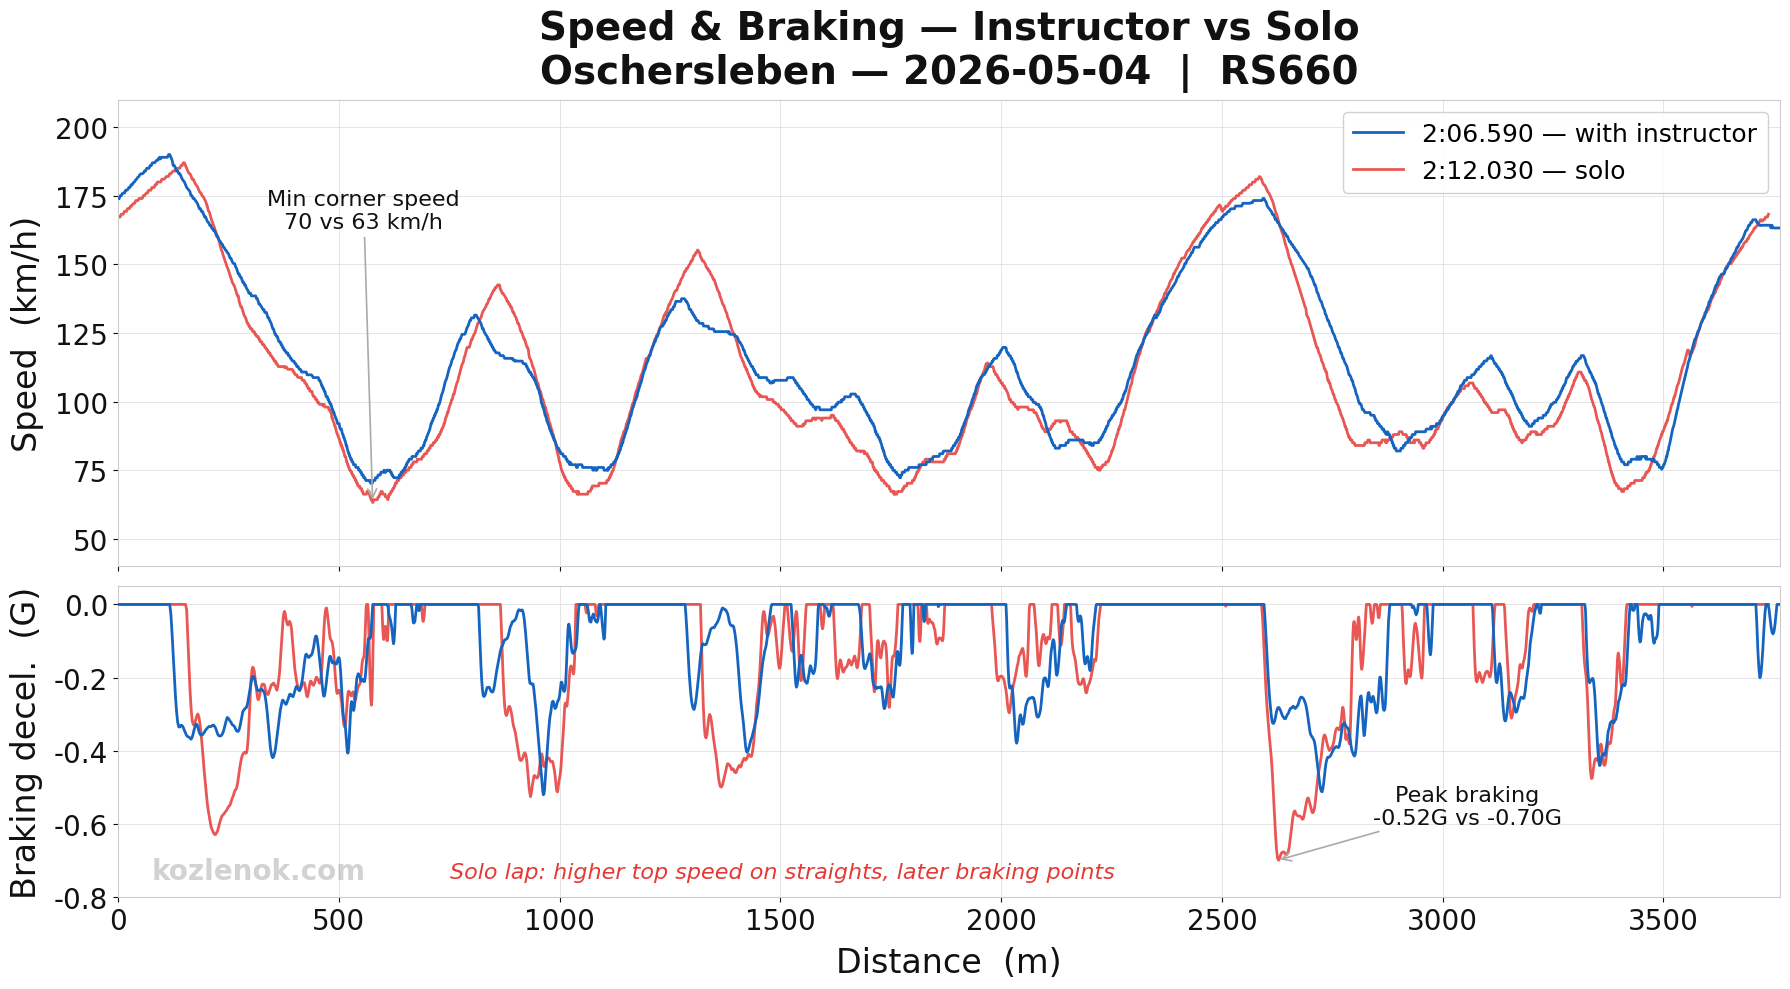
During my first track day on the Aprilia RS660 at Oschersleben, I discovered a massive performance gap between following an instructor and riding solo.
Following an instructor reduced my lap time by nearly 6 seconds. Riding alone led to over-riding, inconsistent references, and eventually a gravel excursion.
The data showed that pushing harder made it worse. Corner speed dropped, not improved. The real problem was attention — split between the dashboard and the track.
Summary
Following the instructor as a visual reference, I was 6 seconds faster and felt no risk
Without a visual reference, compensating with harder braking reduced corner speed in every single corner — despite feeling like I was pushing harder
Hiding the speedometer and focusing entirely on track references added 20 km/h on the main straight — despite wet conditions on day two
Front suspension is only using 50% of available travel — chassis setup is the next priority
Stock suspension was reasonably balanced — rebound damping needed only minor adjustment
Tire temperature sensors revealed the right side running consistently hotter — pressure adjustment brought front and rear into balance at every corner.
Key findings
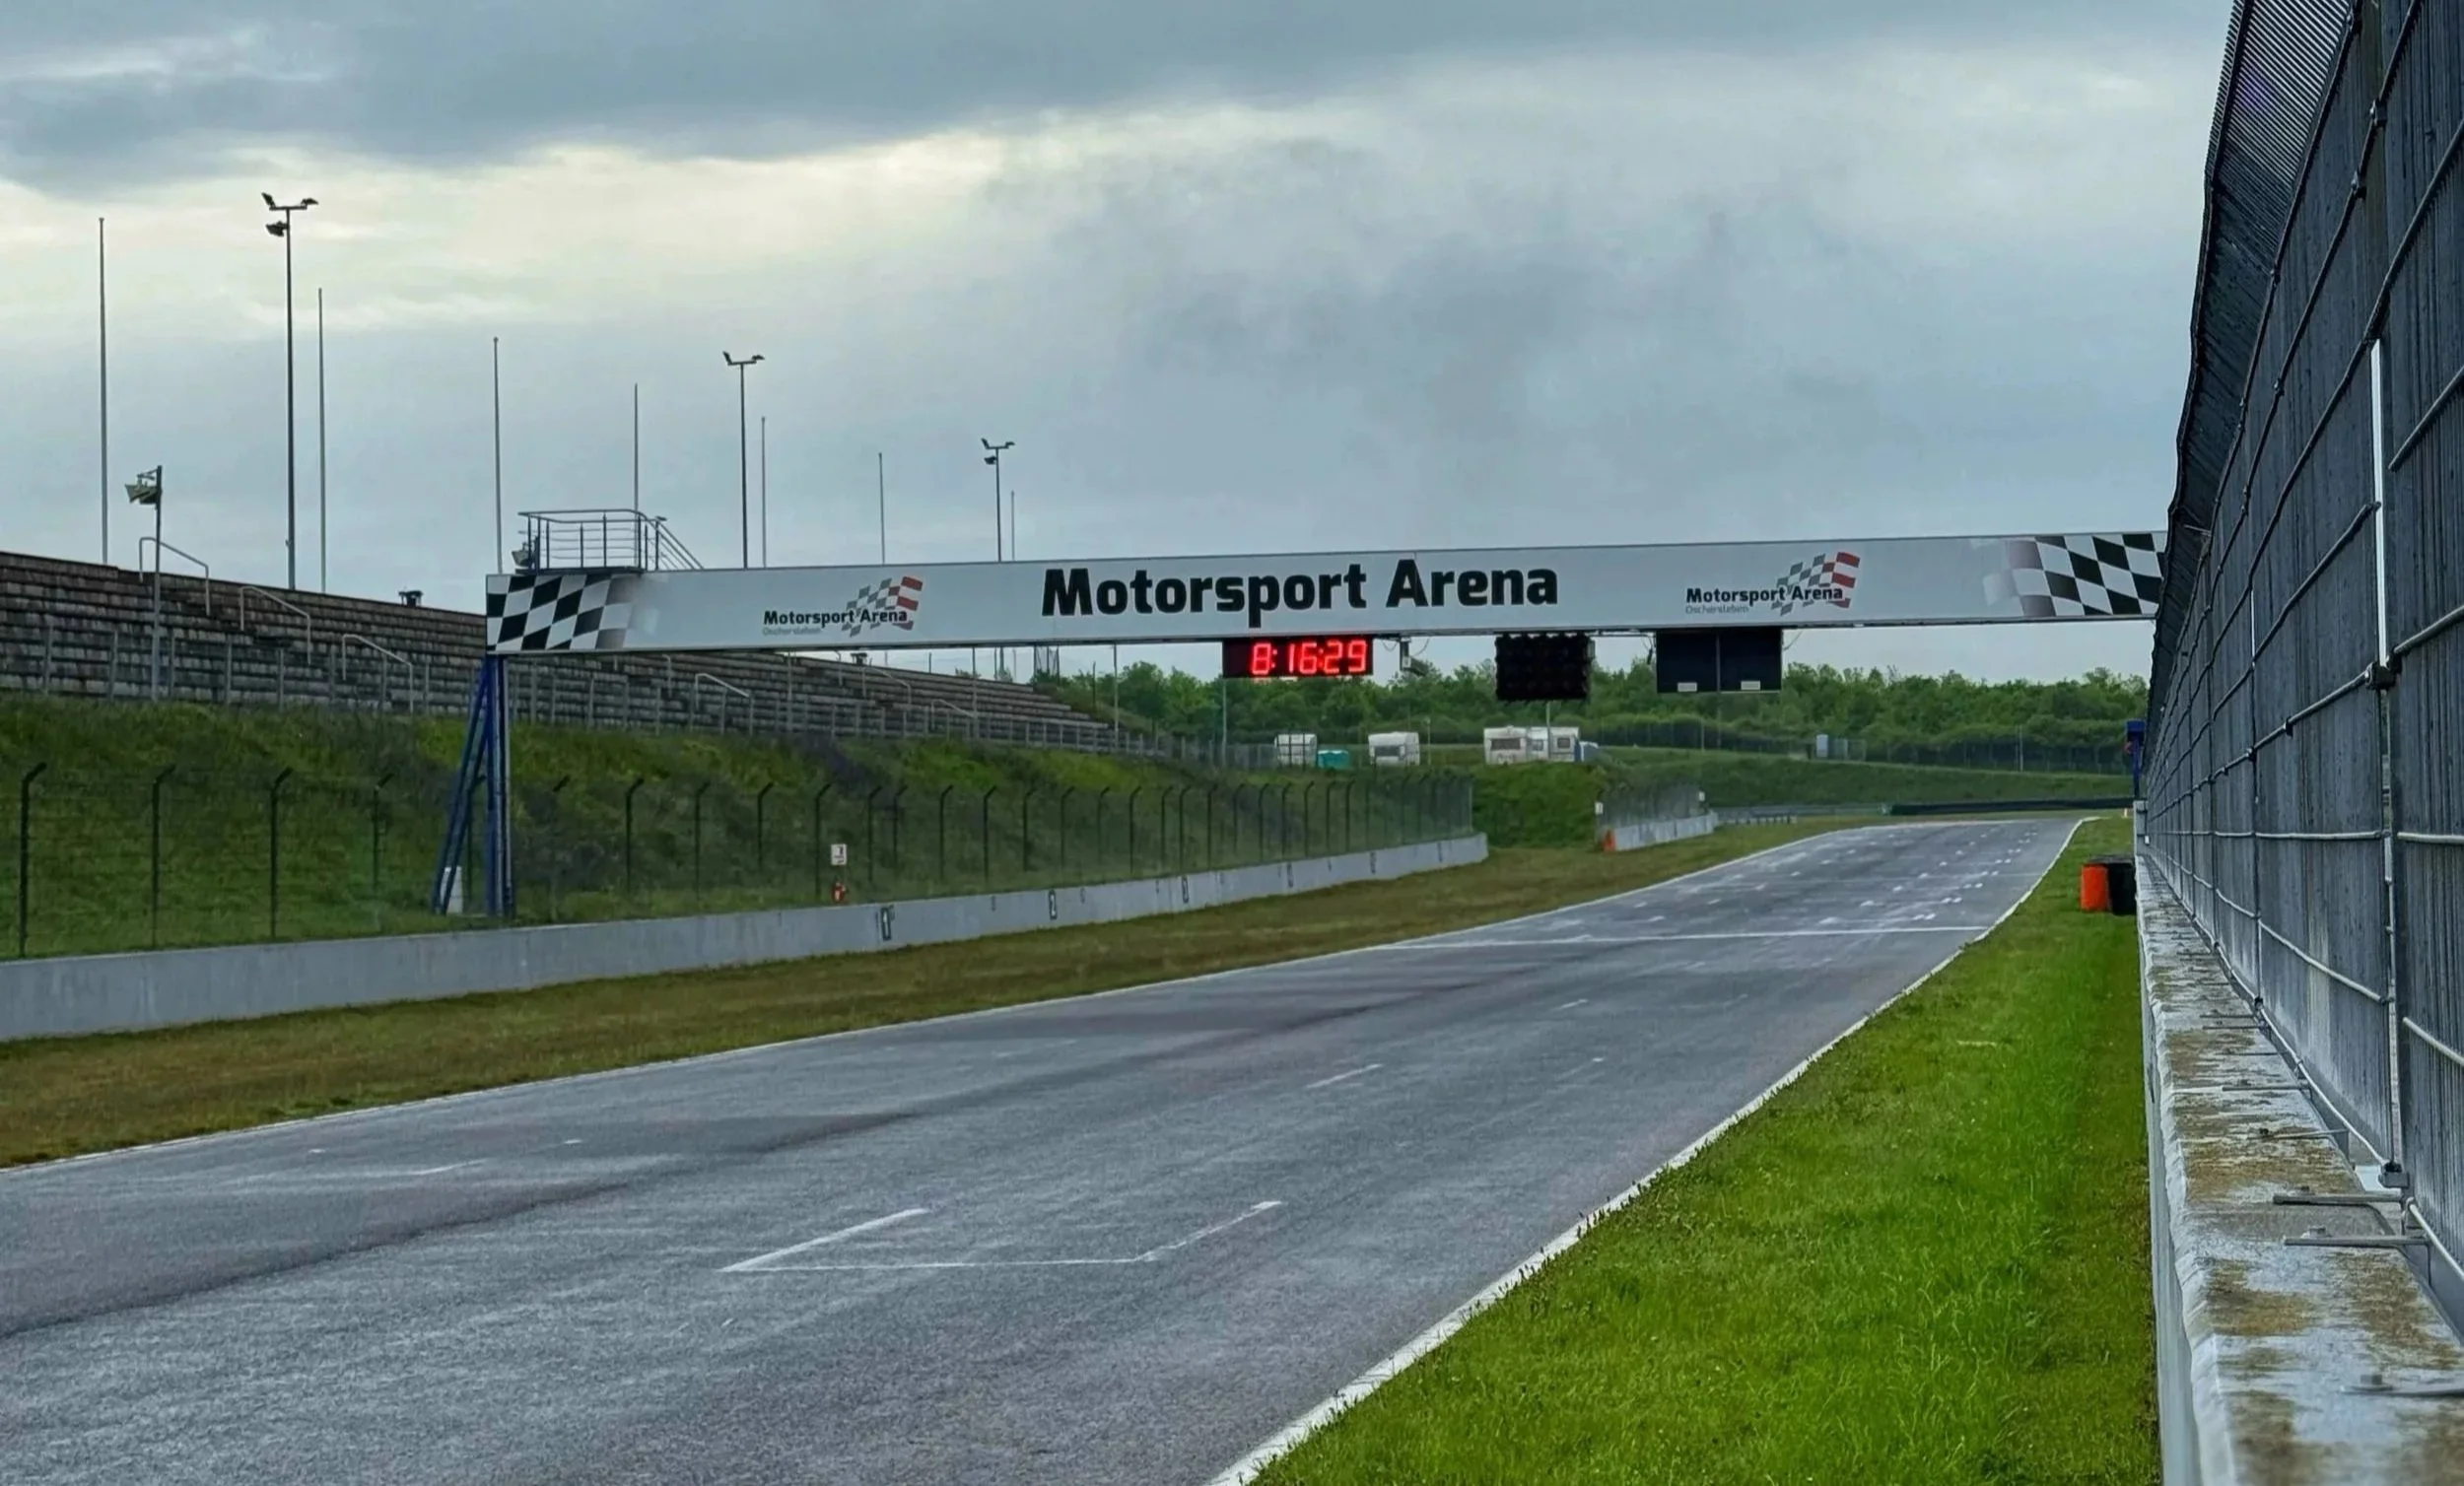
Day One: The 6-Second Gap
Sunny / Partial clouds, +17C to +22C, minimal wind
The first two sessions were paced behind an instructor on an S1000RR. Lap times settled at 2:06 — consistent, no hard braking, no risk. Riding solo immediately after, lap times dropped to 2:12. The gap was repeatable across every session.
As an engineer, I defaulted to what I trusted most — numbers. Speed on the dash. Alone, I stopped trusting the feeling — no confidence in braking points led to coasting or braking too hard, killing corner speed every lap. The instinctive response was to push harder. It made things worse. At the end of the day, overcooking the chicane entry sent me into the gravel — I managed to keep the bike upright and understood that chasing numbers instead of trusting and refining the feelings was clearly not the answer.
In the last three sessions, I decided to be patient and take the time to learn the racing line and master my body position.
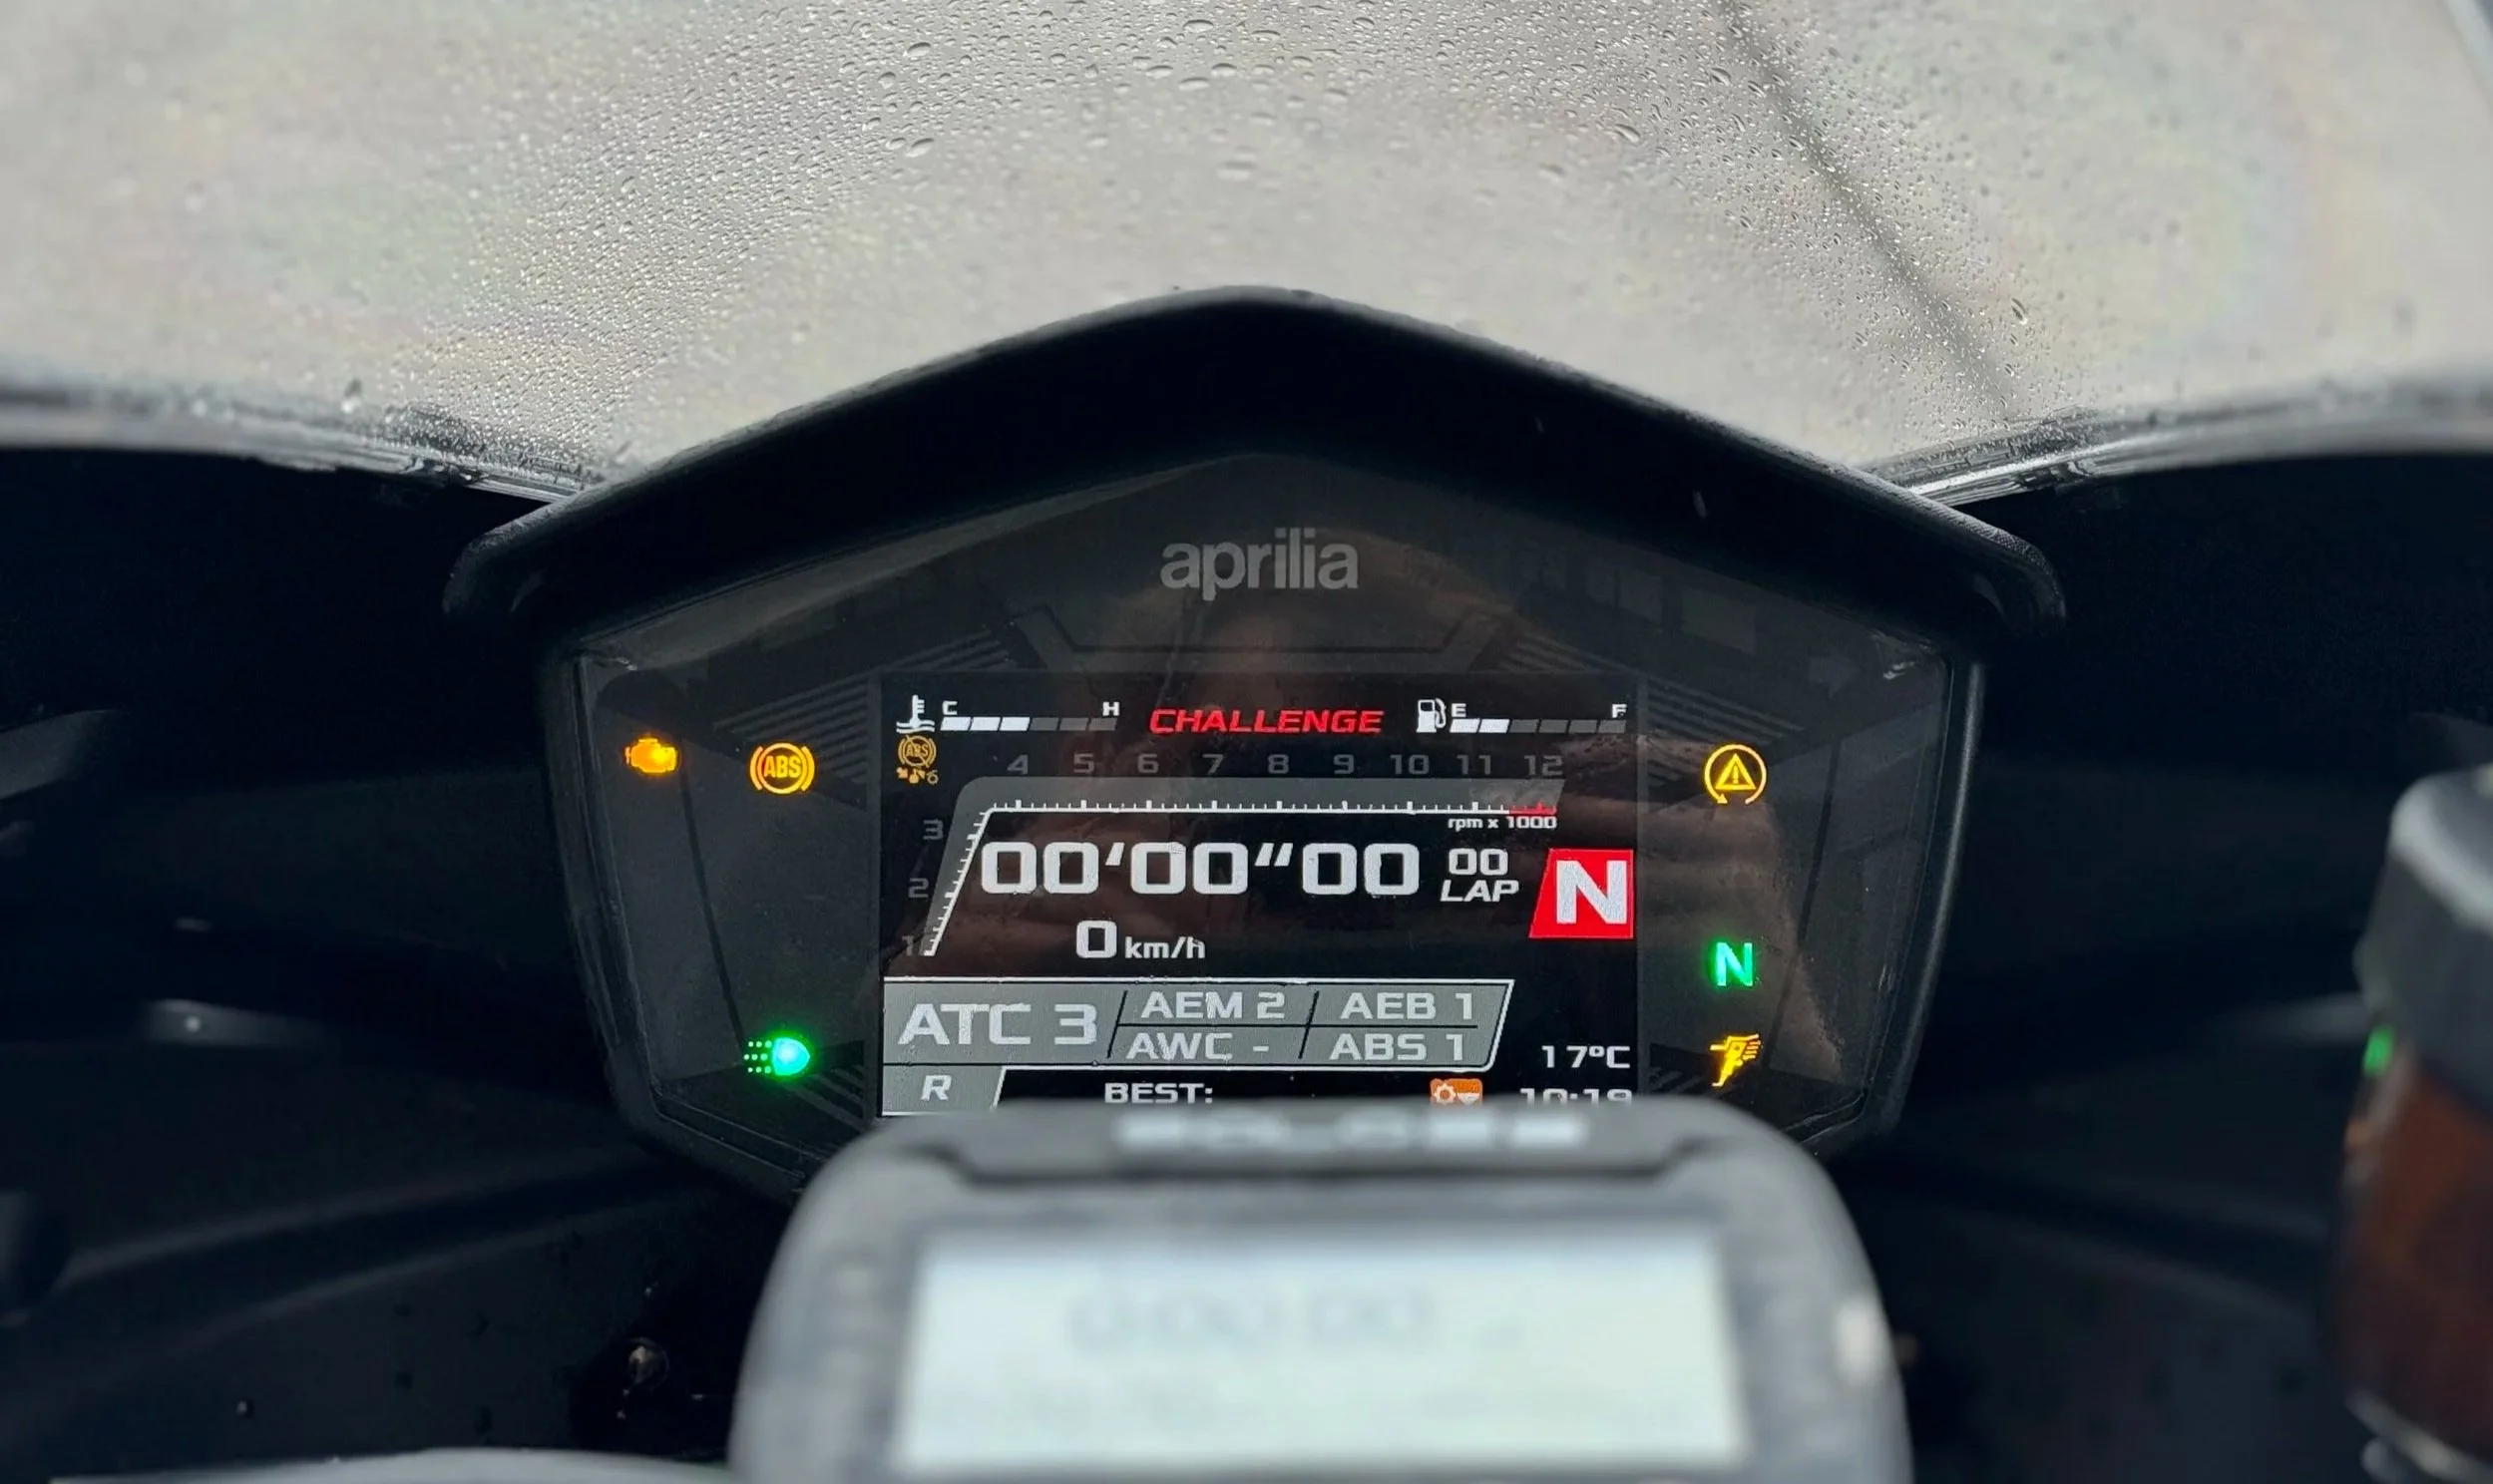
Post-session onboard analysis revealed that I was unable to shift my focus from engineering to riding. Attention was split between the dashboard and the track. On both straights and before each corner entry, I was checking the speed and adjusting it as needed.
For day two, the dash layout was changed to hide the speedometer entirely.
Day Two: The Fix
Rain / Partially wet, +11C to +15C, wind gusts
Before day two, I changed the dash layout — speedometer font minimized to invisible. One variable removed.
Conditions were worse. Morning sessions stayed in the pit until the racing line dried. With road-legal semi-slicks, I had a window during the transition — too dry for wet tires, too wet and cold for slicks — so I raised pressure to 2.4 bar front and rear to keep the tread pattern active and reduce the contact patch.
Best lap was 2:15.6. Slower than day one by nine seconds. But on the main straight, I was 20 km/h faster than any previous session — because without the speedometer, I planned the braking point visually and committed to it fully.
Tech Summary
This chapter offers a glimpse into the data analysis and highlights some practices I use to set up and make riding decisions. Data acquisition setup for my AP RS660 is described on another page.
Suspension
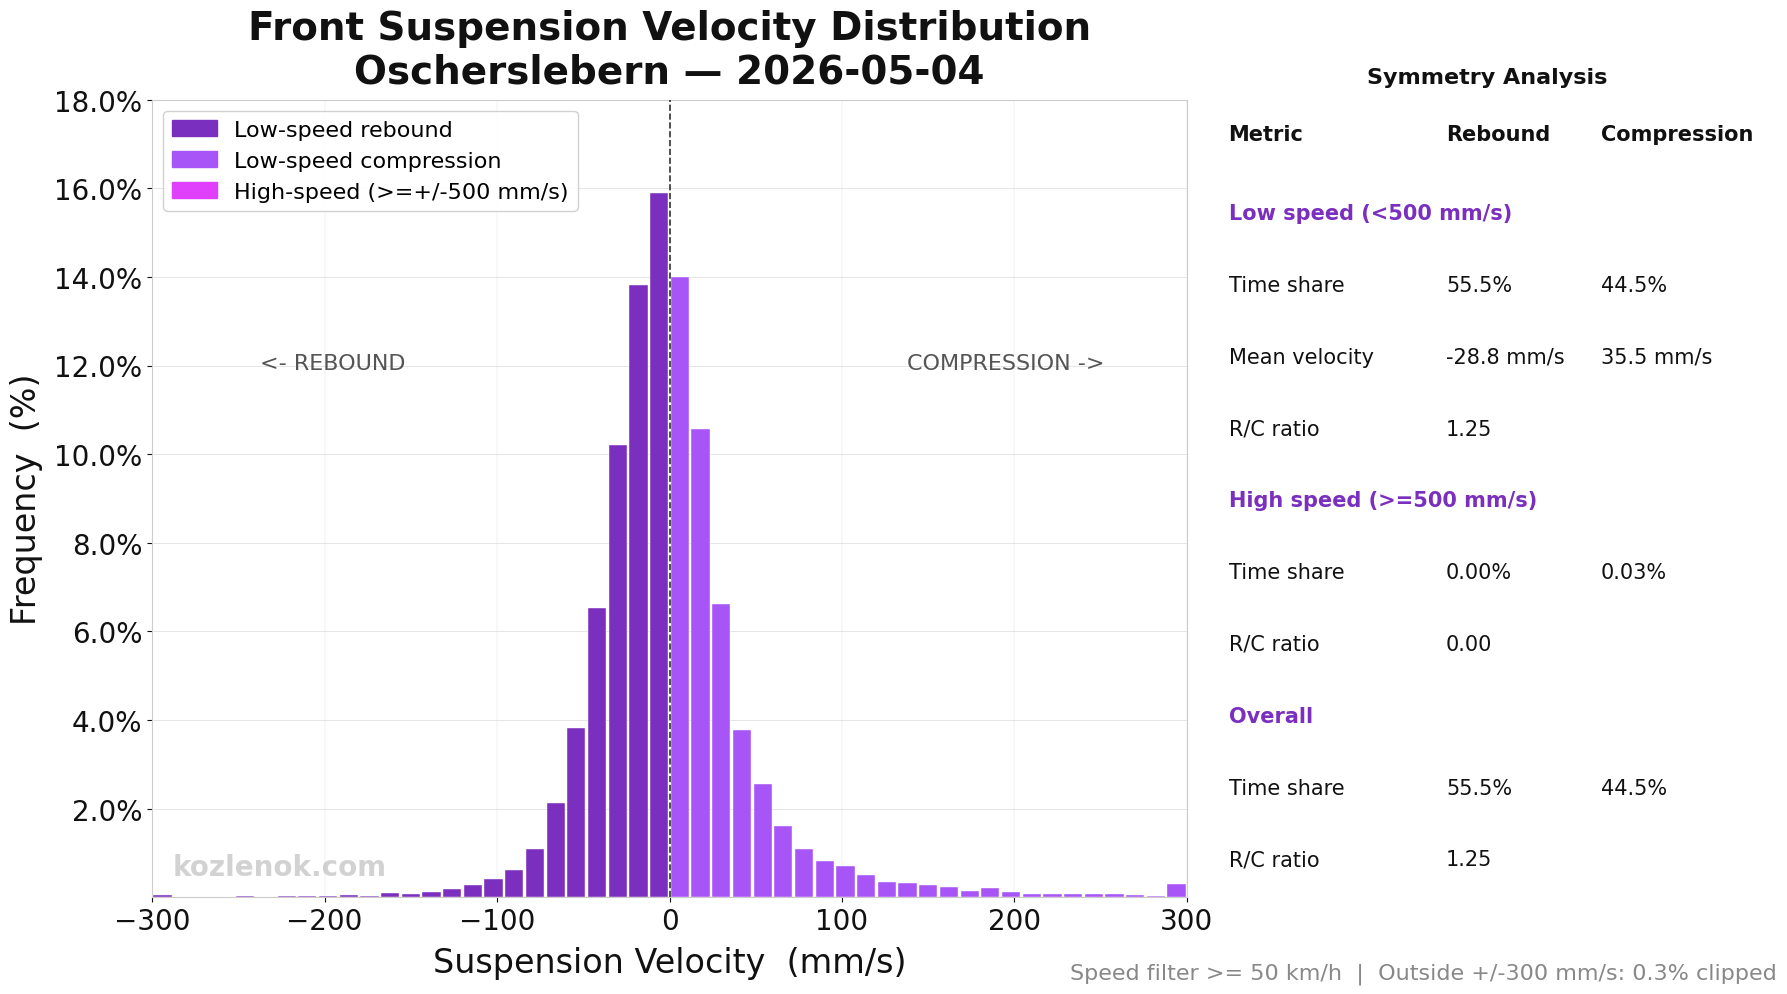
First session with suspension travel logged on the RS660. Stock rebound damping was too fast — the chassis felt unsettled and gave excessive feedback under load. I increased rebound damping to the comfortable setting, stopping before the suspension became overdamped and started pushing back. The plot reflects this: more time on the rebound stroke is the expected signature of higher rebound damping, and on a track as smooth as Oschersleben, that was an acceptable tradeoff.
One clear outlier: suspension velocity only exceeded 200 mm/s at the chicane, where the line cuts the curbs. Oschersleben's surface is exceptionally smooth everywhere else.
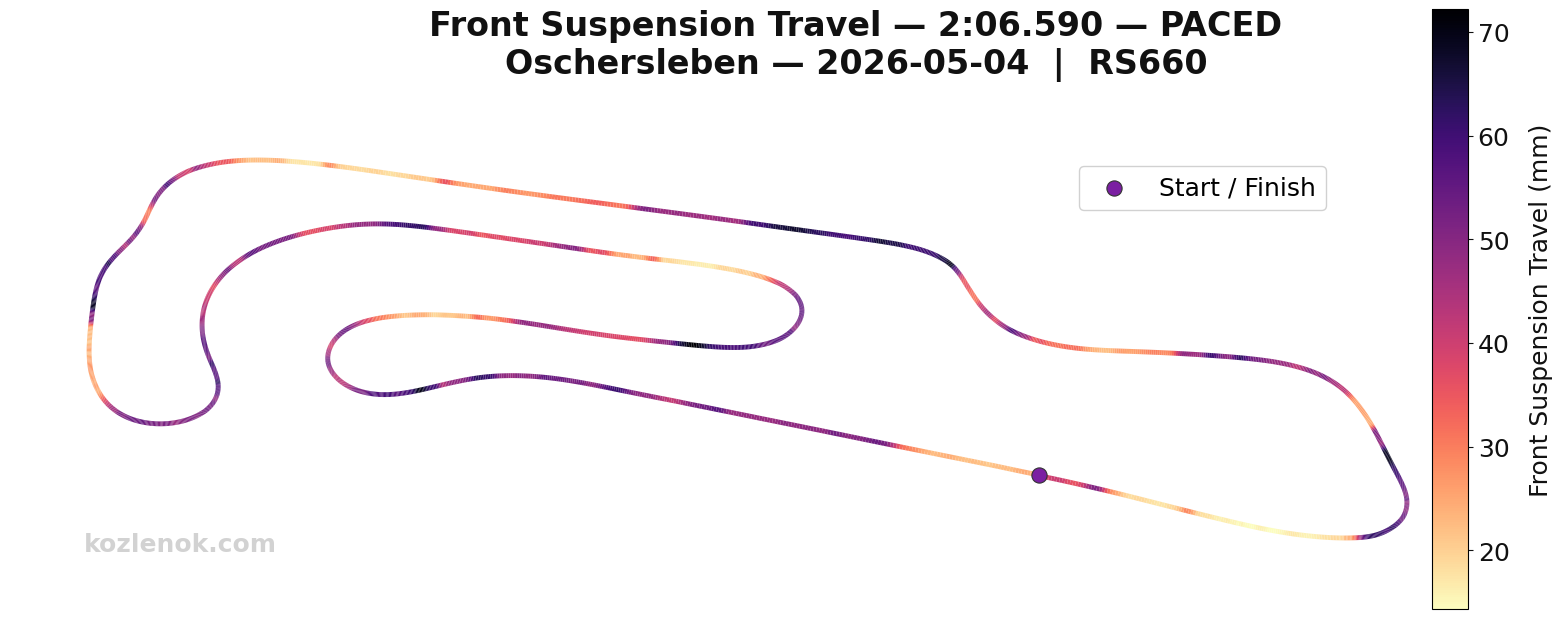
The bigger finding: front suspension is using roughly 50% of available travel. Until the chassis is pitched forward and the geometry corrected, any interpretation of front-end data is incomplete.
G-G Plot
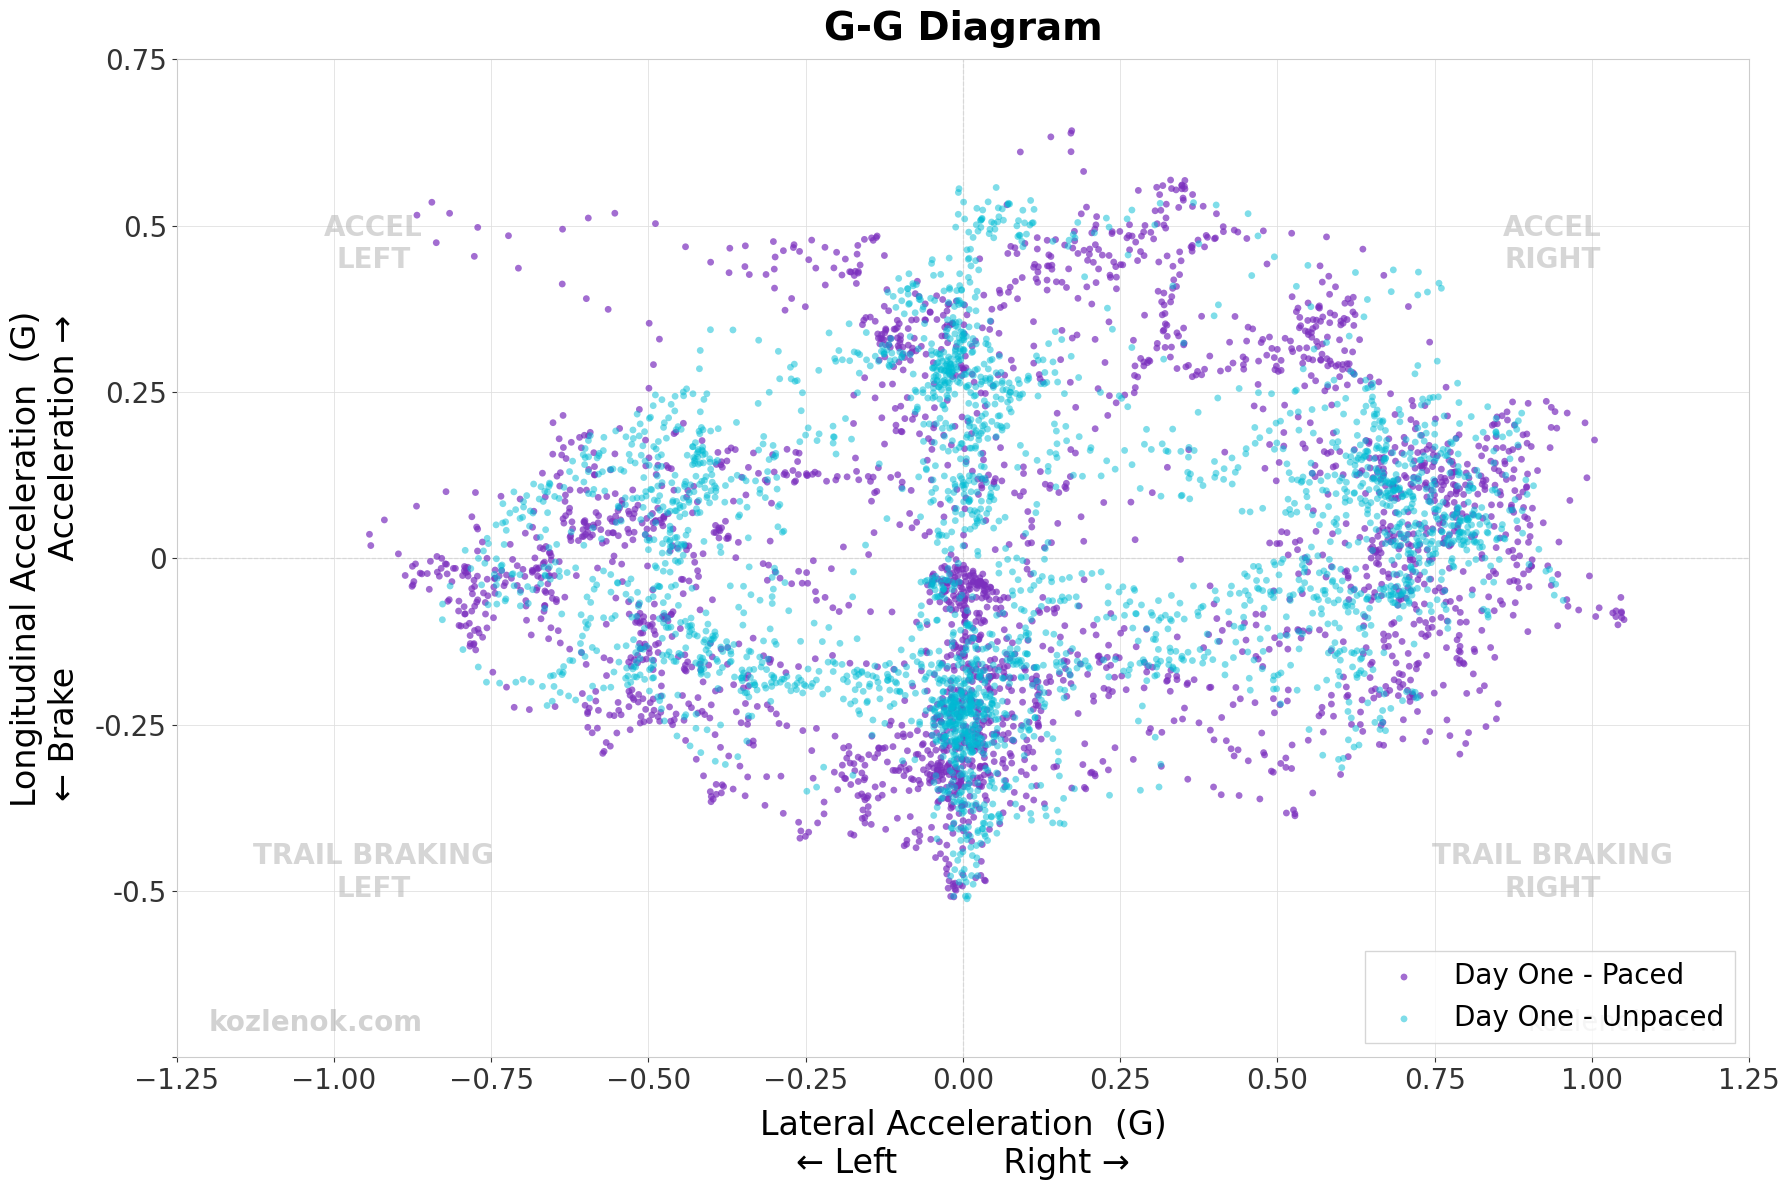
The G-G plot compares the paced session (2:06 — purple) with the first unpaced session (2:12 — cyan). Despite the 6-second gap, the two sessions look nearly identical in shape, which is telling in itself: the time loss wasn't from a single phase; it was distributed throughout.
Differences worth noting:
In the unpaced session, acceleration on the straight bike was more aggressive
In the paced session, braking loads into left-hand corners were higher — chasing the instructor, and having a visual reference ahead, both built confidence on entry
In both sessions, the right-hand corners show denser distribution above 0.75G — I have to master the left side
Tire behaviour
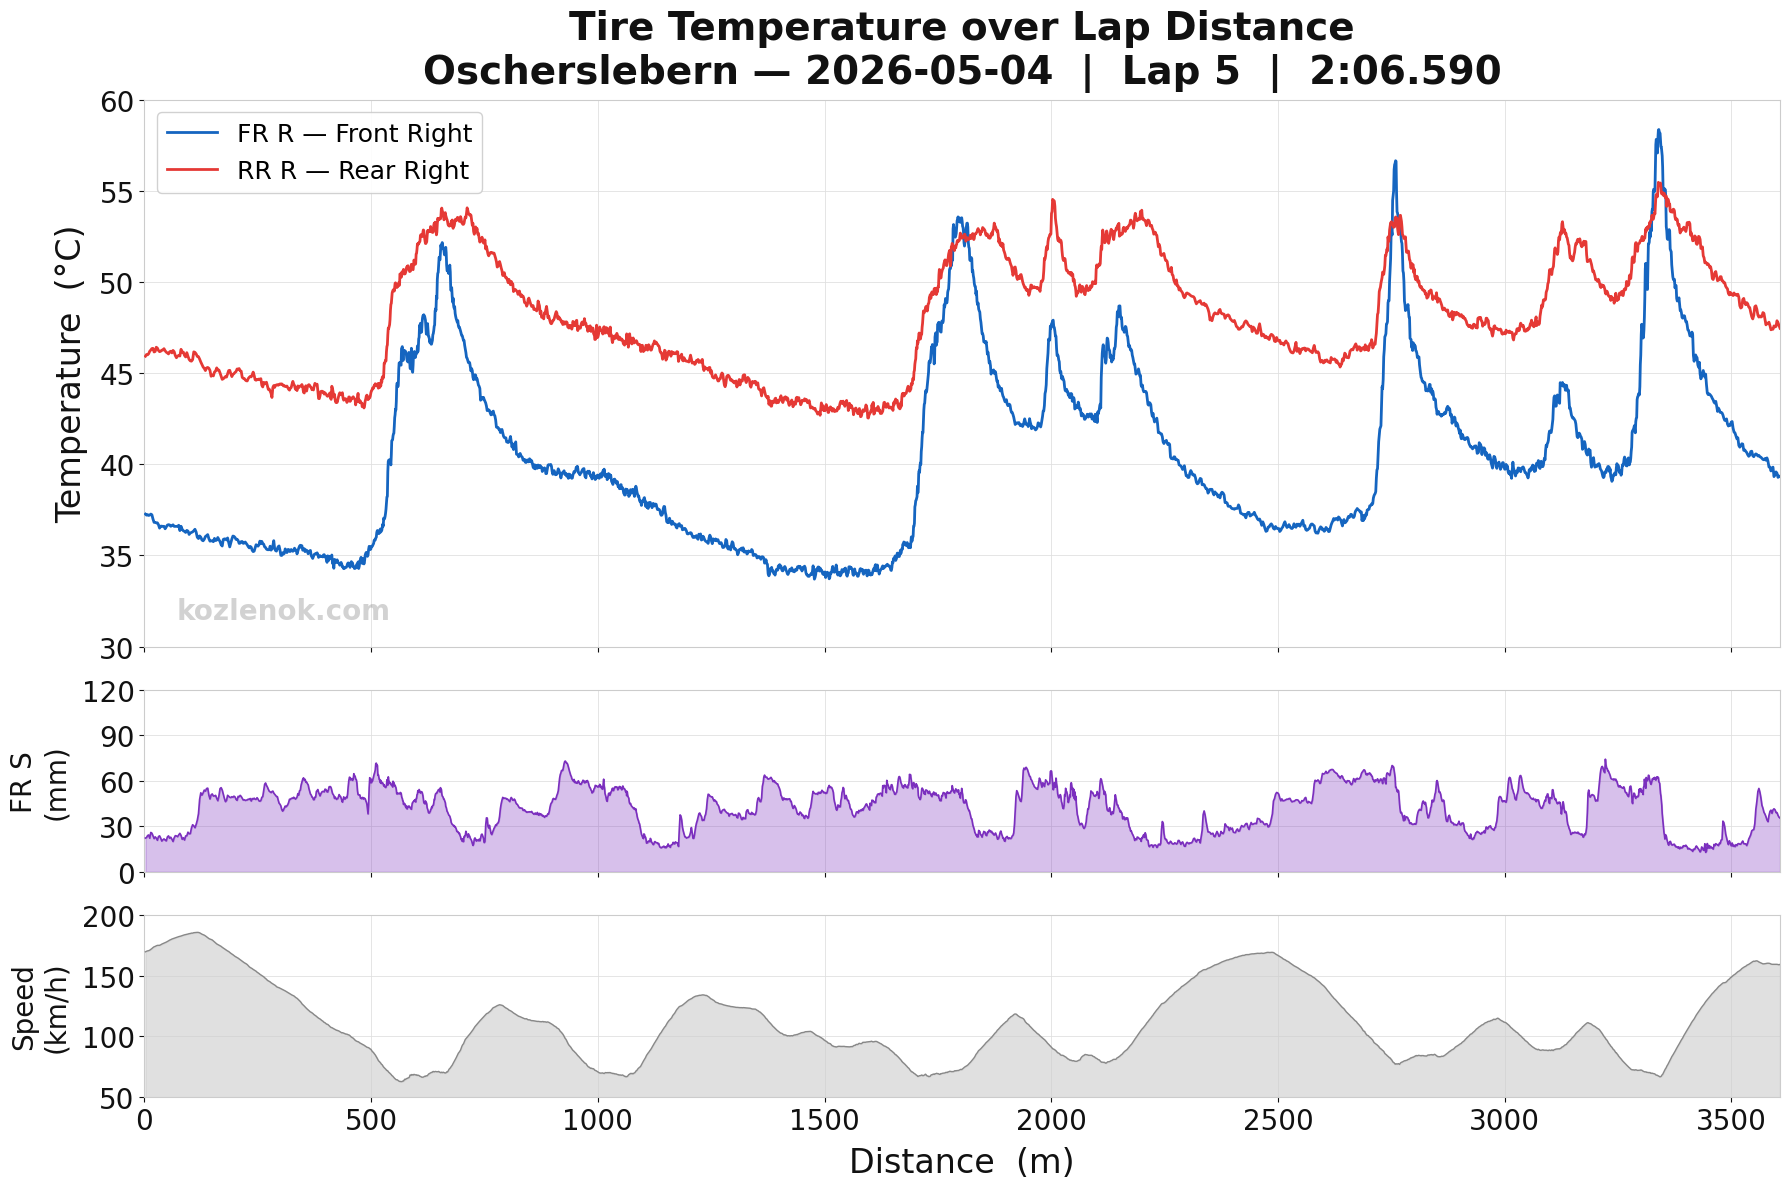
Right-side tires ran consistently hotter than left from session one. On road tires, this matters more than on slicks — the operating window is lower, and overheating is a real risk.
Two sessions of pressure adjustment brought the balance in:
Front: 2.1 bar cold → 58°C at the last corner exit
Rear: 1.8 bar cold → 56°C at the last corner exit
Four points in the data show the front temperature matching or briefly exceeding the rear. Given the rear runs a softer compound and shows more wear, a slightly hotter front at the apex is acceptable. Once the suspension geometry is corrected and the front is using 90%+ of its travel at hard braking, front temperatures will shift significantly — the current readings are a baseline, not a conclusion.
Next Track Day Priorities
Motorcycle setup:
Pitch chassis forward — target 80–90% front suspension travel at hard braking
Match the rear SAG to the new front geometry
Move the shift lever up — too many upshift errors under load
Lock the dash layout with the speedometer hidden.
Piloting:
Revise body position before hard braking zones
Establish a fixed, confident braking marker on both straights
Push the throttle application harder against TC level 5
Work V-line through slow corners and hairpins — flick and drive, not scrub speed.
Cinematic onboard
First Time at Oschersleben 2026 | Aprilia RS660